Michael Shellenberger, founder of Environmental Progress, said “one of the most misleading ways wind and solar sales people sell their technology is they claim the electricity produced by wind and solar is cheaper than fossil.”
“However, the paradox about wind and solar energy is, when deployed at scale, they actually make overall electricity production more expensive”, Shellenberger told CPAC Australia, in Sydney, on Oct. 1
“There are basically two reasons,” he said, “It requires more machines, more backup power generators, more transmission systems, and more people to manage the chaos of an electrical grid with a large amount of unreliable, weather-dependent, variable, intermittent energy.
Such chaos conditions are most severe when electrical systems are highly stressed, such as during peak demands in New England and Texas during cold spells, and in California during heat waves.
Any cost and CO2 analysis of wind has to include natural gas, because wind cannot exist on the grid without natural gas plants.
The more wind system capacity, MW, the more natural gas capacity, MW, for counteracting the variable output of wind.
The more wind, the less efficient the gas plants, due to frequent start/stops, and part-output operating required to be in counteracting mode, 24/7/365
The two dance together, on a less-than, minute-by-minute basis, 24/7/365.
The same holds true for solar.
Electrical systems with significant percentages of electricity from quick-reacting, combined-cycle gas-turbine plants (with adequate fuel supplies) and quick-reacting, hydro-plants (with adequate water storage), can integrate greater percentages of wind and solar, in a more efficient manner, and at lesser additional CO2 emissions, than other grids."
The Penetration Problem. Part I: Wind and Solar – The More You Do, The Harder It Gets
https://www.windtaskforce.org/profiles/blogs/the-penetration-proble...
Shellenberger pointed to a prediction by German economist Leon Hirth, who claims, the economic value of wind and solar significantly decreases, as they become larger percentages of the electricity mix on a grid
.
In a paper for Energy Policy in 2013, Hirth estimated, if:
1) Wind power generation is 30% of the electricity mix on a grid, its value decreases by 40%
2) Solar power generation is 15% of the electricity mix on a grid, its value decreases by 50%.
“The reason is easy to understand,” Shellenberger noted, “Solar and wind produce too much energy when you don’t need them, and not enough energy when you do, and both of those impose operating burdens and costs on the electrical system.
Build-outs of additional wind and solar would generate much more electricity than daily demand, during windy and sunny periods, and far less than daily demand during overcast, snowy, and wind lull periods.
The more wind and solar, the greater the spare capacity, MW, of power plants to ensure continuous electricity service, when wind and solar are minimal.
The wind blowing "somewhere" would require a US-wide HVDC overlay grid, connected at many points to the existing HVAC grids (at least a $500 billion turnkey cost), to bring the "somewhere" electricity to population centers.”
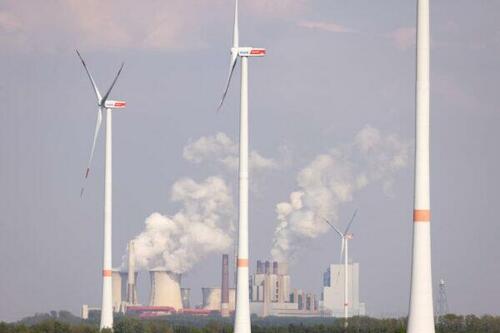
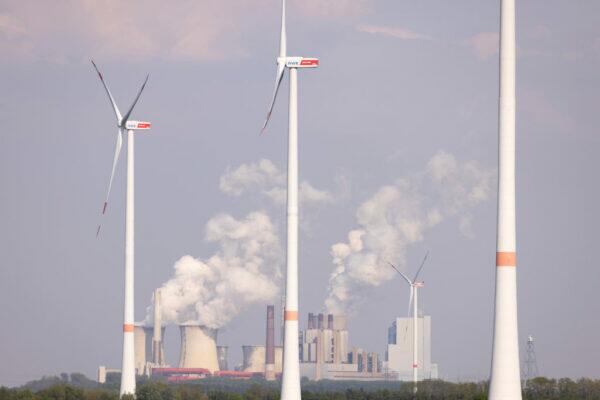
Steam rises from cooling towers of the Neurath coal-fired power plant as wind turbines spin over a field of rapeseed on May 05, 2022 near Bedburg, Germany. (Photo by Andreas Rentz/Getty Images)
He said, the ideal situation is for the electricity supply to exactly equal the variable demand at “all times", i.e., on a less than minute-by-minute basis, 24/7/365
“Every time you take electricity off the grid (i.e., shut down a plant), and put it back on (i.e., start up a plant), you’re paying energy penalties, which increase the cost of the energy generated by those stop/start plants somewhere between 20 to 40 percent. The more stop/star plants involved, the greater the cost impact. That is just one operating burden and cost aspect.
Another operating burden and cost aspect is, more and more plants on the grid have to inefficiently operate at less than rated output, when ramping up and down, to counteract the downs and ups of wind and solar."
Shellenberger said, those cost increases, due to losses/inefficiencies apply, if:
1) Electricity is used to pump water uphill to operate pumped-storage hydro-electric plants; round-trip loss 25 to 40%, on an A-to-Z basis, and
2) Storing excess wind and solar electricity into grid-scale battery systems; round-trip loss 18 to 20%, on an A-to-Z basis.
He noted, it would cost the US about $750 billion dollars to create enough storage to back up the entire country’s electricity grid for just four hours.
“We don’t need to backup the grid for four hours, we need to back it up for weeks or months, if we rely on wind and solar, because there are periods when there’s no, or too little sunlight, and no, or too little, or too much wind, and that happens most often at night,” he said.
What About the Waste?
Eco-activists urge, Western countries must ramp up their efforts to decarbonize, and move towards net-zero by 2050 (whatever that means), with primarily wind and solar as the solution, as they produce neither greenhouse gases, nor polluting emissions.
But Shellenberger, author of “Apocalypse Never: Why Environmental Alarmism Hurts Us All” and “San Fransicko: Why Progressives Ruin Cities,” argued, wind and solar cause greater environmental damage than fossil fuels and nuclear energy.
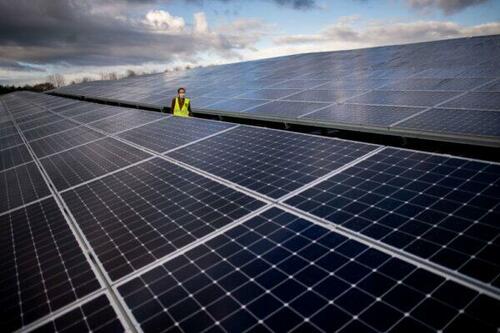
A woman walks through the solar pannels of a photovoltaic power plant installed by Generale du Soleil (GDS) and operated by Energ’iV SEML in a former landfill of waste, on December 8, 2020 in Guignen, western France. (Photo by Loic Venance/AFP via Getty Images).
Just imagine these panels covered with snow and ice for a few days in colder climates, such as New England, and northern Europe
Wind and solar produce 300 times more waste than nuclear plants
Every solar panel removed from a rooftop is categorized as hazardous waste
“The problem is wind and solar actually degrade the natural environment,” he said.
Shellenberger also said, the push for more wind and solar power would result in Western countries moving “in the opposite direction, i.e., towards a ‘higher-material-intensity’ society, than we have under fossil fuels and nuclear.”
According to a report from the International Energy Agency, natural gas and coal require only a small fraction of mining to support their operations, compared to what is needed for wind and solar, and especially for battery systems for EVs, and for grid-scale battery systems.
“At present, we use for energy production about 10% of the mined materials in the world.
If we move towards 100% renewables, primarily wind and solar, the mined materials for energy production would increase to 40 to 50%, which would greatly increase costs, and the costs of electricity/kWh, exactly the opposite of what is claimed by the wind and solar talking heads.
He further said, “the world has ended up burning more coal in 2022, than it has ever before, as a result of:
1) Sanctions, induced by eco-warriors and geo-politics, on fossil fuels, i.e., coal, oil, and gas
2) Obsessions with more and more built-outs of dysfunctional wind and solar
3) Refusals to seriously consider a major commitment to standardized nuclear plants.
The Irrationalists are Making the Rules!
The more wind, the more need for coal, oil and gas. Gee, who would have thought?
Schellenberger shows a true understanding of the wind and solar impacts on the electrical system.
There is a need to realize, there has been some global warming (more warming in some world areas, less warming in other areas) since 1850, but the warming has not been anywhere near what more than 100 subjective computer programs have been predicting since about 1975
All of the computer programs run hot, compared to 43 years of objective balloon and satellite data.
All of the computer programs are incapable of running backwards, to simulate the temperature history of the worldwide:
1) Little Ice Age, LIA, which saw a low-point in the 1690s; there has been warming ever since, despite no significant change in atmospheric CO2, until about 1950
2) Roman Warm Period, RWP, which was warmer than the Present Warm Period, PWP; atmospheric CO2 was less than at present
3) Medieval Warm Period, MWP, which also was warmer than the PWP; atmospheric CO2 was less than at present
See Appendix.
More and more physical facts continue to unmask the scare-mongered, CO2-caused, climate-change farce, kept alive by various special interests, including the traditional "paid for" mass media, that need "access" for survival.
Almost the entire, highly subsidized wind, solar, battery "excursion" of the past 40 years, aims to use dysfunctional energy technology to solve a non-existent problem, that should be managed by adaptation, such as greatly increased efficiency, and elimination of high energy-intensity activities, including big mansions, private yachts and private planes.
Europe's energy crisis as 'clear and present warning' for America
"Compromising American energy security for the sake of climate alarmism is more than a misstep, it is a catastrophic error – just look at the energy mess Europe."
"Defending our nation’s energy economy and independence must be a priority," they continued. "Europe’s energy crisis serves as a clear and present warning of what may lie ahead.
If we continue down Europe's wind, solar, battery road, we would follow them blindly into the same disaster."
https://www.foxbusiness.com/politics/energy-experts-sound-alarm-eur...
NeW England
By the way, all of this, including rolling blackouts at ZUB-ZERO temperatures, and a lack of gas and oil for space heating, applies to New England, if:
1) New York State keeps obstructing new gas pipelines from Pennsylvania to New England; THIS SHOULD BE LEGALLY FORBIDDEN AS AN UNCONSTITUTIONAL INTERFERENCE OF INTER-STATE COMMERCE, and
2) The New England oil, gas and coal storage capacities near power plants are not increased by at least 100% to ensure RELIABLE ELECTRICAL SERVICE IN WINTER, WHICH WOULD BE ESPECIALLY IMPORTANT, IF UNCERTAIN, MOTHER-NATURE, WEATHER-DEPENDENT WIND AND SOLAR WERE FURTHER EXPANDED, AS THE US AIMS TO BLINDLY COPY THAT DISASTROUS EUROPEAN SCENARIO
These articles and image are provided for reference.
.
ISO-NE REPORT OF 2021 ECONOMIC STUDY: FUTURE GRID RELIABILITY STUDY PHASE 1
https://www.iso-ne.com/static-assets/documents/2022/07/2021_economi...
DEEP DIVE SUMMARY OF THE ISO-NE REPORT
https://www.utilitydive.com/news/new-england-future-grid-study-iso/...
LIFE WITHOUT OIL
Life without oil means many products that are made with oil, such as the hundreds listed below, would need to be provided by wind and solar and hydro.
Folks, including Biden's attendants, wanting to get rid of fossil fuels, such as crude oil, better start doing some rethinking.
The above also applies to natural gas, which is much preferred by many industries
If you do not have abundant low-cost energy, you cannot have modern industrial economies.

APPENDIX 1
These articles contain significant information regarding wind, solar and grid-scale battery systems
GRID-SCALE BATTERY SYSTEMS IN NEW ENGLAND TO COUNTERACT SHORTFALL OF ONE-DAY WIND/SOLAR LULL
https://www.windtaskforce.org/profiles/blogs/grid-scale-battery-sys...
COLD WEATHER OPERATION IN NEW ENGLAND DECEMBER 24, 2017 TO JANUARY 8, 2018
https://www.windtaskforce.org/profiles/blogs/cold-weather-operation...
ANALYSIS OF WIND AND SOLAR ENERGY LULLS AND ENERGY STORAGE IN GERMANY
https://www.windtaskforce.org/profiles/blogs/wind-and-solar-energy-...
IRELAND FUEL AND CO2 REDUCTIONS DUE TO WIND ENERGY LESS THAN CLAIMED
https://www.windtaskforce.org/profiles/blogs/fuel-and-co2-reduction...
BATTERY SYSTEM CAPITAL COSTS, OPERATING COSTS, ENERGY LOSSES, AND AGING
https://www.windtaskforce.org/profiles/blogs/battery-system-capital...
HIGH COSTS OF WIND, SOLAR, AND BATTERY SYSTEMS IN US NORTHEAST
https://www.windtaskforce.org/profiles/blogs/high-costs-of-wind-sol...
APPENDIX 2
These articles explain a lot about the world-wide “Climate Crisis” scam, based on highly compromised surface station measurements, which typically read HIGH.
Climate scientists SUBJECTIVELY adjust the readings for use in their SUBJECTIVE computerized-temperature-calculation programs, which are used in the reports of IPCC, etc., for scare-mongering purposes.
New Surface Stations Report Released – It’s ‘worse than we thought’
https://www.windtaskforce.org/profiles/blogs/new-surface-stations-r...
Weather- Just how does it happen?
https://www.windtaskforce.org/profiles/blogs/weather-just-how-does-...
A summary of the results of three “Physics of the Earth’s Atmosphere” papers, which were submitted for peer review at the Open Peer Review Journal.
https://globalwarmingsolved.com/2013/11/19/summary-the-physics-of-t...
APPENDIX 3
Satellites and balloons measure temperatures of the Troposphere, which starts at ground level, and has an average height of 59,000 ft at the tropics, 56,000 ft at the middle latitudes, and 20,000 ft at the poles. Above those levels starts the Stratosphere.
Balloons directly measure temperatures. Satellites measure radiation, from which temperatures are calculated.
Both consistently measure much lower temperatures than the average of 102 computer-generated graphs.
See Appendix 2 and 3
The data in the below images is for a 43-y period.
There is global warming, but it is not anywhere near as much as scare-mongers are claiming.
https://www.windtaskforce.org/profiles/blogs/grid-scale-battery-sys...
1) Objective satellite and balloon temperatures increased from 0.00 to 0.5 C, or, or 0.116 C/decade
2) Subjective computer-generated temperatures increased from 0.00 to 1.20 C; or 0.28 C/decade, about 2.7 TIMES AS FAST
The temperature data by satellites and balloons are more accurate than land-based measurements.
See Appendix 2 and URL
https://en.wikipedia.org/wiki/UAH_satellite_temperature_dataset
Satellite measurements are made many times during every day and systematically cover almost the entire world; +/- 85-degree latitude.
The satellite data is vastly more complete, and accurate than would be gathered by ground stations. (See Appendix 2)
Balloon measurements, made on a sampling basis, are vastly less complete than satellite measurements, but they serve as a useful crosscheck on the satellite measurements.
NOTE: Behind the 102 computer graphs are hundreds of organizations that likely receive a significant part of their revenues from governments and subsidy-receiving wind, solar, battery, etc., businesses.
The livelihood and career prospects of the people creating these graphs is more secure, if they aim high, rather than low.
https://www.scienceunderattack.com/blog/2021/2/22/latest-computer-c...

A more detailed view of satellite temperatures.

APPENDIX 4
Science and Environmental Policy Project (SEPP) and also a member of the CO2 Coalition. Sheahen and the Coalition are collaborating on a brief.
SEPP’s October 8 newsletter contains a summary of a major 2021 paper by Happer and co-author William van Wijngaarden that completely undermines the fake “science” the IPCC and EPA used to support the case of climate alarm. See URL
https://wvanwijngaarden.info.yorku.ca/files/2021/03/WPotency.pdf?x4...
Sheahen specifically discusses the efforts of Professors William van Wijngaarden and William Happer in their pioneering work in calculating the real-world Global Warming Potentials (GWPs) of the five most common Green-House Gases (GHGs).
Sheahan explains why the approach used by IPCC is faulty, but nonetheless used by its followers, such as the US National Center for Atmospheric Research (NCAR) and the EPA.
These faulty methods lead to great exaggeration of the greenhouse effect of carbon dioxide, methane, and other minor greenhouse gases.
Sheahan shows the stunning agreement between the calculations of van Wijngaarden and Happer (W & H) with satellite measurements (and balloon measurements) of outgoing infrared radiation emitted by the earth to space . . .
Sheahan claims, because of the exceptionally good agreement between observational data and the calculations of W & H, we can conclude the W&H model has been validated.
The W&H model embodies the scientific method, i.e., it is reasonable to use it to study other hypothetical cases.
It is not possible to do so with IPCC models, which have never achieved agreement with observations.
See Appendix 3
The gist of the H&W work is the greenhouse effect of CO2 in the atmosphere is almost entirely saturated, such that any additional CO2 can have almost no additional warming effect.
Here is a chart prepared by Sheahan to illustrate the H&W results.
As atmospheric CO2 increases, say from 380 to 420 ppm; the 40 ppm increase has about 0.05C warming effect.
As atmospheric CO2 increases, say from 20 to 60 ppm; the 40 ppm increase has about a 0.5C warming effect.


You need to be a member of Citizens' Task Force on Wind Power - Maine to add comments!
Join Citizens' Task Force on Wind Power - Maine