SOME COMMENTS ON TEMPERATURES
The average temperature has gone up just over 1 C in 100 years.
Temperatures go up and down 5 to 10 C, or more, every day, so that really is not a big deal!
If you step out from the shade on a sunny day, you experience a 10 C or so increase.
The alarm of an increase of 1-plus/100y cannot be justified as catastrophic!
100-plus years ago:
-There were not many weather stations worldwide. They covered less than 2% of the world land area.
- Above the entire ocean area (71% of the planet’s surface), there were no air temperature measurements at all!
- Thermometers were used only on land. Many were not 1) high quality, 2) properly-calibrated, or 3) cross-checked.
- The only accurate data are 42 years of satellite data since 1979. The graph of the data indicates much lower temperatures than of computer-generated graphs, which are based on agenda-driven, massaged/adjusted data
Thus, the BASE-POINT of the 100y-old temperature reference from which to judge what has happened during the past 100 years is extremely dubious, to say the least.
New Surface Stations Report Released – It’s ‘worse than we thought’
96% OF U.S. CLIMATE DATA IS CORRUPTED
CONCLUSION OF THE STUDY
Official NOAA temperature stations produce corrupted data due to purposeful placement in man-made hot-spots, in violation of NOAA guidelines, to ensure these stations read higher temperatures than if the stations were placed in the proper locations!!
This is done for scare-mongering purposes by the deep-state climate bureaucrats to advance their agendas.
Nationwide study follows up widespread corruption and heat biases found at NOAA stations in 2009, and the heat-bias distortion problem is even worse now
ARLINGTON HEIGHTS, IL (July 27, 2022) – A new study, Corrupted Climate Stations: The Official U.S. Surface Temperature Record Remains Fatally Flawed, finds approximately 96 percent of U.S. temperature stations used to measure climate change fail to meet what the National Oceanic and Atmospheric Administration (NOAA) considers to be “acceptable” and uncorrupted placement by its own published standards.
 https://wattsupwiththat.com/wp-content/uploads/2022/07/surfacestati...
 300w" data-lazy-loaded="1" sizes="(max-width: 560px) 100vw, 560px" loading="eager" />
The report, published by The Heartland Institute, was compiled via satellite and in-person survey visits to NOAA weather stations that contribute to the “official” land temperature data in the United States.
The research shows that 96% of these stations are corrupted by localized effects of urbanization – producing heat-bias because of their close proximity to asphalt, machinery, and other heat-producing, heat-trapping, or heat-accentuating objects.
Placing temperature stations in such locations violates NOAA’s own published standards (see section 3.1 at this link), and strongly undermines the legitimacy and the magnitude of the official consensus on long-term climate warming trends in the United States.
“With a 96 percent warm-bias in U.S. temperature measurements, it is impossible to use any statistical methods to derive an accurate climate trend for the U.S.” said Heartland Institute Senior Fellow Anthony Watts, the director of the study. “Data from the stations that have not been corrupted by faulty placement show a rate of warming in the United States reduced by almost half compared to all stations.”
NOAA’s “Requirements and Standards for [National Weather Service] Climate O...” instructs that temperature data instruments must be “over level terrain (earth or sod) typical of the area around the station and at least 100 feet from any extensive concrete or paved surface.”
And that “all attempts will be made to avoid areas where rough terrain or air drainage are proven to result in non-representative temperature data.” This new report shows that instruction is regularly violated.
READ THE REPORT (PDF).
For more information, or to speak with the authors of this study please contact Vice President and Director of Communications Jim Lakely at jlakely@heartland.org or call/text 312-731-9364.
This new report is a follow up to a March 2009 study, titled “Is the U.S. Surface Temperature Record Reliable?” which highlighted a subset of over 1,000 surveyed stations and found 89 percent of stations had heat-bias issues.
In April and May 2022, The Heartland Institute’s team of researchers visited many of the same temperature stations as in 2009, plus many not visited before.
The new survey sampled 128 NOAA stations, and found the problem of heat-bias has only gotten worse.
“The original 2009 surface stations project demonstrated conclusively that the federal government’s surface temperature monitoring system was broken, with the vast majority of stations not meeting NOAA’s own standards for trustworthiness and quality.
Investigations by government watchdogs OIGand GAO confirmed the 2009 report findings,” said H. Sterling Burnett, director of the Arthur B. Robinson Center on Climate and Environment Policy at The Heartland Institute who surveyed NOAA surface stations himself this spring.
“This new study is evidence of two things.
First, the government is either inept or stubbornly refuses to learn from its mistakes for political reasons.
Second, the government’s official temperature record can’t be trusted. It reflects a clear urban heat bias effect, not national temperature trends.”
An example of the bias problem
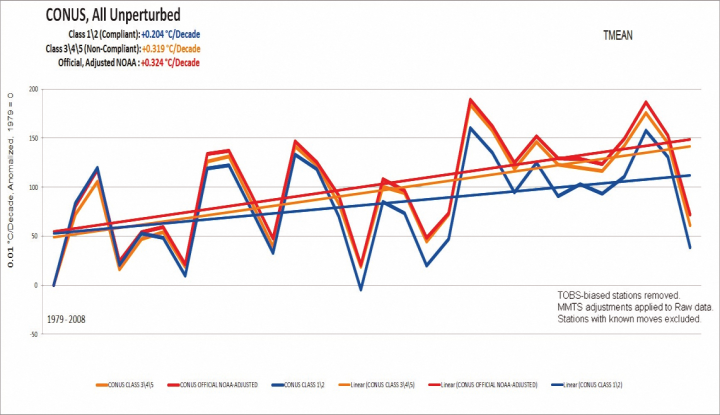
The chart below, found on page 17 of the report, shows 30 years of data from NOAA temperature stations in the Continental United States (CONUS). The blue lines show recorded temperatures and the trend from stations that comply with NOAA’s published standards. The yellow lines are temperatures taken from stations that are not compliant with those standards (i.e. near artificial hot spots). The red lines are the “official” adjusted temperature released by NOAA.
 https://wattsupwiththat.com/wp-content/uploads/2022/07/surfacestati...
 300w,
https://wattsupwiththat.com/wp-content/uploads/2022/07/surfacestati... 768w,
https://wattsupwiththat.com/wp-content/uploads/2022/07/surfacestati... 1142w" data-lazy-loaded="1" sizes="(max-width: 720px) 100vw, 720px" loading="eager" />
“If you look at the unperturbed stations that adhere to NOAA’s published standard – ones that are correctly located and free of localized urban heat biases – they display about half the rate of warming compared to perturbed stations that have such biases,” Watts said.
“Yet, NOAA continues to use the data from their warm-biased century-old surface temperature networks to produce monthly and yearly reports to the U.S. public on the state of the climate.”
“The issue of localized heat-bias with these stations has been proven in a real-world experiment conducted by NOAA’s laboratory in Oak Ridge, Tennessee and published in a peer reviewed science journal.” Watts added.
“By contrast, NOAA operates a state-of-the-art surface temperature network called the U.S. Climate Reference Network,” Watts said. “It is free of localized heat biases by design, but the data it produces is never mentioned in monthly or yearly climate reports published by NOAA for public consumption.
CO2 Not A Dangerous Gas
It is about 0.042% in the atmosphere, 4% in exhaled breath,
0.2% in an auditorium or a pub, or 5 times greater than in the atmosphere, 0.4 to 0.5% in a submarine, or more than 10 times greater than in the atmosphere.
Submariners live in that safe CO2 environment for periods of 6 months or so.
Sea levels have been measured worldwide for well over a century and the level-increase is only about 2mm/year (or less). Some land areas like in Scandinavia are actually subsiding (sinking). There is no sea-level crisis anywhere in the world, and no sudden upsurge has been recorded anywhere in the world.
Artic and Antarctic sea-ice areas and thickness are on average the same for the last 50 years, and within the normal annual ranges. There are no sudden changes anywhere.
Floating-ice shelf areas larger than the size of Australia melt every 6 months, and are reinstated in the next months at BOTH poles.
Carbon dioxide is the vital ‘food stock’ for all plants, shrubs, crops, and trees. The small increase in carbon dioxide over the last few decades has marvelously caused ‘global greening’, and crop and vegetable yields have risen 15 to 30 percent.
In the Netherlands, etc., carbon dioxide is fed to Green Houses to increase plant and crop growth rates! Carbon dioxide has been a real boon in all food-producing countries in the world.
It is important to understand water vapor is over 20 times higher in concentration than carbon dioxide, and is over 50 times more effective with all radiation.
Water vapor is over 5,000 higher in concentration than methane, and more than 4,000 more effective with all radiation].
THE REAL PROBLEMS
The real problems are not the gases themselves, such as carbon dioxide, or methane from farming, or from vehicles, or industry, but from incomplete combustion and atmospheric pollution (both chemicals and particles). Worldwide biomass burning is a major culprit.
Pollutants, such as heavy metals, unburned carbon particles, dioxins, organic chemicals, like benzene and fluorocarbons, toxins, and many more, can come from natural fires, all combustion process, industry, volcanic eruptions, and more.
Sea levels have been measured worldwide for well over a century and the level-increase is only about 2mm/year (or less). Some land areas like in Scandinavia are actually subsiding.
There is no sea-level crisis anywhere in the world, and no sudden upsurge has been recorded anywhere at all in the world.
Artic and Antarctic sea-ice areas and thickness are on average the same for the last 50 years, and within the normal annual ranges. There are no sudden changes anywhere.
Floating-ice shelf areas, larger than the size of Australia, melt every 6 months, and are reinstated in the next months at BOTH poles.
Carbon dioxide is the vital ‘food stock’ for all plants, shrubs, crops, and trees. The small increase in carbon dioxide over the last few decades has marvelously caused ‘global greening’, and crop and vegetable yields have risen 15 to 30 percent.
In the Netherlands, etc., carbon dioxide is fed to Green Houses to increase plant and crop growth rates! Carbon dioxide has been a real boon in all food producing countries in the world.
It is important to understand water vapor is over 20 times higher in concentration than carbon dioxide, and is over 50 times more effective with all radiation.
Water vapor is over 5,000 higher in concentration than methane, and over 4,000 more effective with all radiation.
NEW ENGLAND
By the way, all of this, including rolling blackouts at ZUB-ZERO temperatures, and a lack of gas and oil for space heating, applies to New England, if:
1) New York State keeps obstructing new gas pipelines from Pennsylvania to New England; THIS SHOULD BE LEGALLY FORBIDDEN AS AN UNCONSTITUTIONAL INTERFERENCE OF INTER-STATE COMMERCE, and
2) The New England oil, gas and coal storage capacities near power plants are not increased by at least 100% to ensure RELIABLE ELECTRICAL SERVICE IN WINTER, WHICH WOULD BE ESPECIALLY IMPORTANT, IF UNCERTAIN, MOTHER-NATURE, WEATHER-DEPENDENT WIND AND SOLAR WERE FURTHER EXPANDED, AS THE US AIMS TO BLINDLY COPY THAT DISASTROUS EUROPEAN SCENARIO
These articles and image are provided for reference.
.
ISO-NE REPORT OF 2021 ECONOMIC STUDY: FUTURE GRID RELIABILITY STUDY PHASE 1
https://www.iso-ne.com/static-assets/documents/2022/07/2021_economi...
DEEP DIVE SUMMARY OF THE ISO-NE REPORT
https://www.utilitydive.com/news/new-england-future-grid-study-iso/...
LIFE WITHOUT OIL
Life without oil means many products that are made with oil, such as the hundreds listed below, would need to be provided by wind and solar and hydro.
Folks, including Biden's attendants, wanting to get rid of fossil fuels, such as crude oil, better start doing some rethinking.
The above also applies to natural gas, which is much preferred by many industries
If you do not have abundant low-cost energy, you cannot have modern industrial economies.

APPENDIX 1
These articles contain significant information regarding wind, solar and grid-scale battery systems
GRID-SCALE BATTERY SYSTEMS IN NEW ENGLAND TO COUNTERACT SHORTFALL OF ONE-DAY WIND/SOLAR LULL
https://www.windtaskforce.org/profiles/blogs/grid-scale-battery-sys...
COLD WEATHER OPERATION IN NEW ENGLAND DECEMBER 24, 2017 TO JANUARY 8, 2018
https://www.windtaskforce.org/profiles/blogs/cold-weather-operation...
ANALYSIS OF WIND AND SOLAR ENERGY LULLS AND ENERGY STORAGE IN GERMANY
https://www.windtaskforce.org/profiles/blogs/wind-and-solar-energy-...
IRELAND FUEL AND CO2 REDUCTIONS DUE TO WIND ENERGY LESS THAN CLAIMED
https://www.windtaskforce.org/profiles/blogs/fuel-and-co2-reduction...
BATTERY SYSTEM CAPITAL COSTS, OPERATING COSTS, ENERGY LOSSES, AND AGING
https://www.windtaskforce.org/profiles/blogs/battery-system-capital...
HIGH COSTS OF WIND, SOLAR, AND BATTERY SYSTEMS IN US NORTHEAST
https://www.windtaskforce.org/profiles/blogs/high-costs-of-wind-sol...
APPENDIX 2
These articles explain a lot about the world-wide “Climate Crisis” scam, based on highly compromised surface station measurements, which typically read HIGH.
Climate scientists SUBJECTIVELY adjust the readings for use in their SUBJECTIVE computerized-temperature-calculation programs, which are used in the reports of IPCC, etc., for scare-mongering purposes.
New Surface Stations Report Released – It’s ‘worse than we thought’
https://www.windtaskforce.org/profiles/blogs/new-surface-stations-r...
Weather- Just how does it happen?
https://www.windtaskforce.org/profiles/blogs/weather-just-how-does-...
A summary of the results of three “Physics of the Earth’s Atmosphere” papers, which were submitted for peer review at the Open Peer Review Journal.
https://globalwarmingsolved.com/2013/11/19/summary-the-physics-of-t...
APPENDIX 3
Satellites and balloons measure temperatures of the Troposphere, which starts at ground level, and has an average height of 59,000 ft at the tropics, 56,000 ft at the middle latitudes, and 20,000 ft at the poles. Above those levels starts the Stratosphere.
Balloons directly measure temperatures. Satellites measure radiation, from which temperatures are calculated.
Both consistently measure much lower temperatures than the average of 102 computer-generated graphs.
See Appendix 2 and 3
The data in the below images is for a 43-y period.
There is global warming, but it is not anywhere near as much as scare-mongers are claiming.
https://www.windtaskforce.org/profiles/blogs/grid-scale-battery-sys...
1) Objective satellite and balloon temperatures increased from 0.00 to 0.5 C, or, or 0.116 C/decade
2) Subjective computer-generated temperatures increased from 0.00 to 1.20 C; or 0.28 C/decade, about 2.7 TIMES AS FAST
The temperature data by satellites and balloons are more accurate than land-based measurements.
See Appendix 2 and URL
https://en.wikipedia.org/wiki/UAH_satellite_temperature_dataset
Satellite measurements are made many times during every day and systematically cover almost the entire world; +/- 85-degree latitude.
The satellite data is vastly more complete, and accurate than would be gathered by ground stations. (See Appendix 2)
Balloon measurements, made on a sampling basis, are vastly less complete than satellite measurements, but they serve as a useful crosscheck on the satellite measurements.
NOTE: Behind the 102 computer graphs are hundreds of organizations that likely receive a significant part of their revenues from governments and subsidy-receiving wind, solar, battery, etc., businesses.
The livelihood and career prospects of the people creating these graphs is more secure, if they aim high, rather than low.
https://www.scienceunderattack.com/blog/2021/2/22/latest-computer-c...

A more detailed view of satellite temperatures.

APPENDIX 4
Science and Environmental Policy Project (SEPP) and also a member of the CO2 Coalition. Sheahen and the Coalition are collaborating on a brief.
SEPP’s October 8 newsletter contains a summary of a major 2021 paper by Happer and co-author William van Wijngaarden that completely undermines the fake “science” the IPCC and EPA used to support the case of climate alarm.
Sheahen specifically discusses the efforts of Professors William van Wijngaarden and William Happer in their pioneering work in calculating the real-world Global Warming Potentials (GWPs) of the five most common Green-House Gases (GHGs).
Sheahan explains why the approach used by IPCC is faulty, but nonetheless used by its followers, such as the US National Center for Atmospheric Research (NCAR) and the EPA.
These faulty methods lead to great exaggeration of the greenhouse effect of carbon dioxide, methane, and other minor greenhouse gases. . . .
Sheahan shows the stunning agreement between the calculations of van Wijngaarden and Happer (W & H) with satellite measurements (and balloon measurements) of outgoing infrared radiation emitted by the earth to space . . .
Sheahan claims, because of the exceptionally good agreement between observational data and the calculations of W & H, we can conclude the W&H model has been validated.
The W&H model embodies the scientific method.
In that case, it is reasonable to use it to study other hypothetical cases.
It is not possible to do so with IPCC models, which have never achieved agreement with observations. . .
See Appendix 3
The gist of the H&W work is the greenhouse effect of CO2 in the atmosphere is almost entirely saturated, such that any additional CO2 can have almost no additional warming effect.
Here is a chart prepared by Sheahan to illustrate the H&W results.
As atmospheric CO2 increases, say from 380 to 420 ppm, it has less warming effect.
The most warming effect occurs at very low levels of CO2, say 20 to 60 ppm.

You need to be a member of Citizens' Task Force on Wind Power - Maine to add comments!
Join Citizens' Task Force on Wind Power - Maine