It is absolutely necessary to have highly reliable electricity service, if we are forced by the government to "ELECTRIFY", i.e., have heat pumps, and electric vehicles, and electric ovens.
This article will show:
1) The wind/solar generation shortfall, and turnkey capital cost, due to a one-day wind/solar lull in New England
2) The electricity drawn from the high-voltage grid to enable grid-scale battery systems to counteract the one-day shortfall
Europe Learning an Expensive Wind/Solar Lesson in 2021, Before Ukraine Events in 2022
There was hot weather and plenty of sunshine, but little wind and little rain, i.e., a drought, in Europe, in 2021
As a result, there was plenty of solar electricity, but less than normal wind and hydro electricity
French nuclear plant output had to be curtailed, due to: 1) delaying proper maintenance, 2) strikes for higher wages, and 3) insufficient cooling water. France, instead of a major exporter, became an importer of electricity.
Norwegian reservoir hydro plants had to reduce their outputs. Electricity exports to Germany were stopped. Household electric prices were increased to 40 c/kWh and EV charging to 80 c/kWh
https://rechargeinfra.com/no/prices/
Europe, in addition to the scrounging around to replace Russian gas, also had to fire up all of its gas plants, and re-start some retired coal plants, and, in Germany, keep some nuclear plants running, to offset the unreliability of weather-dependent electricity, such as wind, solar, hydro, and even nuclear.
Wind and Solar are Deficient Electricity Sources
Wind and solar could not be fed to the NE grid, unless the traditional power plants were present to counteract their output variations, on a less than minute-by-minute basis, 24/7/365, year-after-year, plus there is:
1) No wind electricity at windspeeds of less than 6 mph and greater than 50 mph,
2) No solar electricity with snow and ice on the panels and at night,
3) Near- zero wind and solar electricity during late afternoon/early-evening, i.e., peak demand hours
https://www.windtaskforce.org/profiles/blogs/wind-turbines-only-gen...
That means, almost none of the traditional power plants, and their fuel supplies and fuel storage capacity, can be shutdown, if wind and solar become high percentages of the annual electricity loaded onto the NE grid.
It would be very prudent, to have a large capacity, MW, of coal, oil, and gas plants, that are staffed, with nearby fuel supplies and fuel storage capacity, kept in good working order, to be ready to operate, on demand, especially during:
1) Peak demand hours of late-afternoon/early-evening
2) Wind/solar lulls that could last 5 to 7 days, and could be followed by another multi-day wind/solar lull a few days later, before any battery systems could have been recharged!!
Wind systems generate electricity when the wind is blowing, but zero electricity when the air is still.
Solar systems generate electricity when the sun is shining, especially around noontime, but generate less electricity when the sky is cloudy, and near-zero electricity when: 1) the sky is dark or foggy, and 2) panels are covered with snow and ice for up to several days.
As a result, wind and solar cannot function as dispatchable resources, i.e., they cannot be quickly deployed, on demand, such as during the peak-demand periods of late-afternoon/early-evening.
Electrical System Cost Impact of Integrating Wind.
The first few percent of annual wind contribution make little difference to overall costs, so the cost remains about the all-in, levelized cost of energy, All-in LCOE
Add a few more wind percent, and you start to need to invest in additional grid stabilization to cope with flicker.
Add a few more wind percent, and you start to adversely hit the efficient operating regimes of other power plants on the grid, which:
1) Forces them to operate at reduced outputs, while counteracting the ups and downs of wind, which is less efficient; more Btu/kWh, more CO2/kWh, and more c/kWh
2) Causes increased wear and tear that adds to maintenance cost; more Btu/kWh, more CO2/kWh, and more c/kWh
3) Increases the frequency of plant cold start/stops, which is inefficient; more Btu/kWh, more CO2/kWh, and more c/kWh
4) Increased operation in hot, synchronous standby mode, to immediately provide electricity to the grid at needed; more Btu/kWh, more CO2/kWh, and more c/kWh
5) Means Owners must recoup various costs, such as for capital, staffing, fuel, O&M, etc., spread over reduced electricity sales volumes; more c/kWh
Add a few more wind percent, and you reach the point at which wind has to be curtailed to ensure enough synchronized plants remain on the grid to provide grid-stabilizing inertia.
Add a few more wind percent, and wind output has to be curtailed, because it exceeds demand during low-demand hours and energy storage is unable to cope economically.
Add few more wind percent, and the hours of curtailment increase, and the amounts of curtailment during low-demand hours also increase. Overall curtailment increases exponentially. Owners need to recoup costs from sales of the un-curtailed output, plus they need curtailment payments; increased c/kWh for consumers.
Meanwhile, during stronger winds and surplus electricity output, wholesale prices would be near zero, or even negative, which requires extra subsidies to ensure enough synchronized plants remain on the grid to provide grid-stabilizing inertia.
Output on windless days is barely affected by increased wind capacity, i.e., if little wind, there will be little output, no matter how many wind turbines.
Battery storage, other than as an aid to grid stabilization, remains uneconomic.
Adding more and more wind percent, will more and more decrease the usefulness of its output, because more and more of it will be curtailed.
The net result of decreasing the usefulness of wind turbines by building more wind turbines is a rapidly escalating multiple of the LCOE of the wind turbines.
Plus, there is the LCOE for the increased grid expansion/augmentation of connecting all these wind turbines.
Plus, there is the LCOE for the increased adverse impact on the economics of the counteracting power plants, etc.
Such a large build-out of wind would still not replace the need for almost 100% standby/backup plants, because, if little wind, there will be little output no matter how many wind turbines.
All-in Turnkey Capital Costs of Grid-Scale Battery Systems; 2020 pricing
The battery system would need to provide a certain level of power, MW, and energy, MWh, during a one-day wind/solar lull.
At present, the existing power plants, connected to the NE high-voltage grid, augmented with imports, supply the required MW and MWh, during the peak hours of late-afternoon/early-evening
During a wind/solar lull, and a peak grid load of 27,500 MW:
- Solar would be near zero during late-afternoon/early-evening
- Wind likely would be less than 15% of annual average, during late-afternoon/early-evening.
The US all-in turnkey capital costs of complete battery systems (various technologies) in 2020, including land, foundations, fencing, lighting, step-up and step-down transformers was about $550/kWh, delivered as AC at battery voltage, per EIA annual survey reports.
https://www.windtaskforce.org/profiles/blogs/battery-system-capital...
The US average price/kWh (various technologies) has decreased during the 2015 to 2020 period, because li-ion systems are less expensive and have become a greater part of the storage system mix.
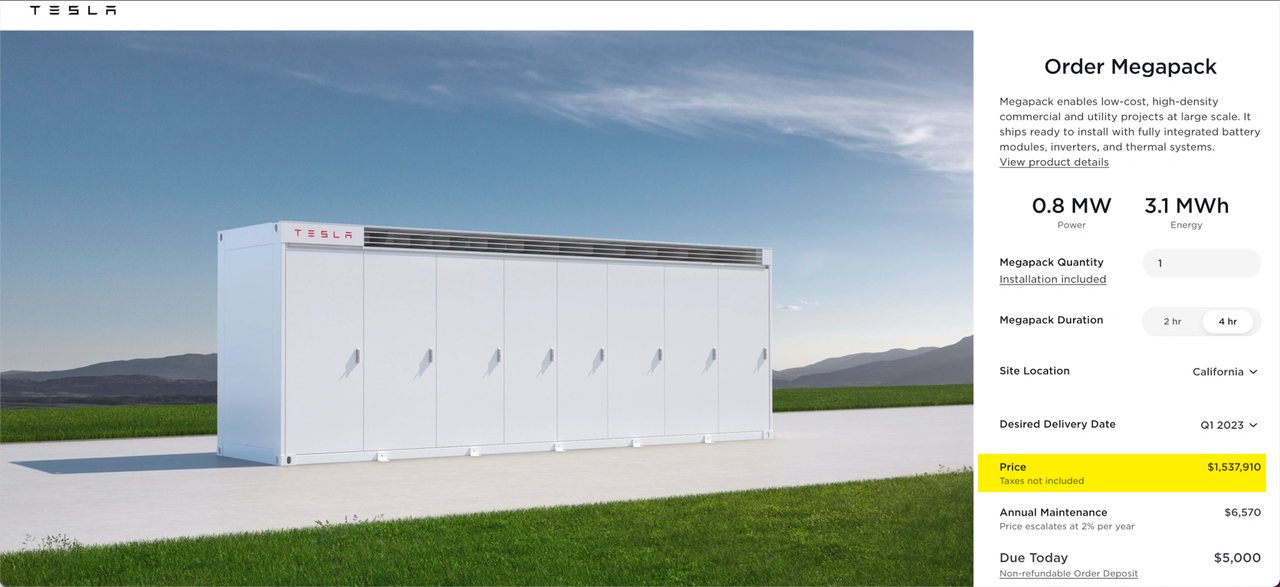
NOTE: After looking at several aerial photos of large-scale battery systems with many Tesla-supplied Megapacks, it is clear many other items of equipment are shown, other than the Tesla supply, such as step-down/step-up transformers, connections to the grid, land, foundations, access roads, fencing, security, site lighting, i.e., the cost of the Tesla supply is only one part of the total battery system cost on a site.
All-in Turnkey Capital Costs of Grid-Scale Battery Systems in the Future
Recently, Tesla, one of the largest suppliers of li-ion, grid-scale battery systems in the world, increased its 2021 pricing for a standard module Megapack by 24.5% for 2022. See URL
The Megapack pricing, and the pricing for complete grid-scale battery systems, likely will be much higher in 2025, due to:
1) Increased inflation rates
2) Increased interest rates
3) Costly, project-delaying, supply chain disruptions
4) Increased energy prices, such as of oil, gas, coal, etc.
5) Increased materials prices, such as of tungsten, cobalt, lithium, copper, manganese, etc. See URLs
6) Increased labor rates
https://cms.zerohedge.com/s3/files/inline-images/2022-03-21_15-28-4...
https://www.zerohedge.com/commodities/tesla-hikes-megapack-prices-c...
NOTE: Proponents of grid-scale battery systems, such as financial advisors Bloomberg, Lazard, etc., have been claiming the cost of grid-scale battery systems would be decreasing to $300/kWh, delivered as AC, at battery voltage, in the near future.
Such claims are similar to the mantra "Nuclear power will be too cheap to meter".
Such claims have been, and will be, off-the-charts ridiculous for at least the next 10 years
Wind: Bigger offshore wind turbines requiring specialized onshore assembly facilities and specialized ships, which are owned mostly by five European companies.
Due to various cost factors, the 20-year spreadsheets of wind/solar/battery systems, of a few years ago, do no longer make any sense. As a result, the following would be required:
1) Much greater subsidies per kWh to developers
2) Expensive grid expansion and augmentation
3) Expensive counteracting, by the other generators, of the up/down variations and intermittencies of increased wind and solar
4) Much greater charges to ratepayers and taxpayers, c/kWh
All that would knee-cap the NE economy with a much more expensive electrical system.
All that would render the US even less competitive in world markets, much to the delight of competitors
All that would make the US more vulnerable to increased trade and balance of payments deficits, and increased foreign control of the US economy
Analysis
We assume the following:
- All-in turnkey cost for li-ion systems at $400/kWh, delivered as AC, at battery voltage; 2020 pricing, i.e., before recent cost increases.
See All-in Turnkey Capital Costs of Grid-Scale Battery Systems in the Future
- Battery systems age at about 1.5%/y; the capacity loss would be about 25% in year 15
- Tesla recommends operating battery systems, on a regular basis, from 20% full to 80% full (i.e., a 0.6 availability factor), for maximum useful service life, about 15 years.
- Grid-scale battery systems almost always operate well within 20/80 range, except during infrequent circumstances, such as randomly occurring wind/solar lulls, when operation can be from 10% full to 90% full, if needed.
- The battery systems likely would not be 80% full at the start of a wind/solar lull, therefore we assume, batteries are 70% full, at the start of a wind/solar lull, and a discharge to 10%, which yields a 0.6 availability factor.
Battery Systems in New England
If the fossil (coal, oil, gas) and nuclear plants were shut down, per wishful thinking of Net-Zero folks, and if hydro plants (6%), tree-burning plants (2%) and garbage-burning plants (3%), and Misc. (1%) remained at 12% of the New England grid load, the main power sources would be wind, solar and battery systems.
https://www.iso-ne.com/about/key-stats/resource-mix/
Each wind and solar system would be required to have its own battery system to act as:
1) Dampers of output variations
2) Storage, in case of wind/solar lulls
If, as part of a "compromise", the remaining fossil and nuclear plants would load 50% of the annual electricity onto the NE grid, and wind and solar would load 50%, the average active battery power capacity would be 6145.8 MW, for a one-day lull.
The electricity leaving the battery would be 6145.8 MW x 24 h = 147,500 MWh, or 0.147500 TWh, as calculated under Step-by-Step Battery System Losses, Step 2
We assume there would be at least 4500 battery modules, each about 3 MW.
Some units likely would be down for scheduled and unscheduled outages
Each module would be rated to provide 3 MW for 24 hours; current modules provide at most 4 hours.
The rated delivery of electricity would be 4500 x 3 x 24 = 259,700 MWh, as AC
The turnkey capital cost would be 259,700 MWh x $400/kWh, delivered as AC = $1.037 trillion, lasting about 15 years
A 24-h wind/solar lull, with wind/solar at 50% of the annual grid load of New England, would require a $1.0 trillion battery system, if that battery system were the only source of making up the wind/solar shortfall.
All of the rated delivery would be not available, because, to achieve long operating life, say 15 years:
- The battery, when new, would deliver 4500 x 3 x 24 x 0.6, availability factor (as above calculated) = 194,400 MWh
- The battery, when aged, would deliver 194,400 x 0.8, aging factor = 155,520 MWh, which is slightly greater than 147,500 MWh
NOTE: Any electricity passing through the battery system would have a loss of about 18%, if new, about 20%, if aged.
See Step-by-Step Battery System Losses
Multi-Day and Second Wind/Solar Lulls
Wind/solar lulls often last 1 to 3 days, but some lulls last 5 to 7 days, and may be followed by a second multi-day lull a few days later, as happen in Germany (See above images) and in NE, when the battery systems may not yet be adequately full, because they could have been at about 10 or 20% full after counteracting the first lull.
In case of a second lull, 1) a spare battery system, and/or 2) adequate standby CCGT plant capacity, MW, staffed, kept in good order, with adequate full storage systems, would be required for continuous electric service.
NOTE: I have lived in my house, at 1000-ft elevation, in Vermont, for 32 years. My observations are:
1) There is almost no wind from about 5 am to about 10 am, almost every day. Solar is minimal as well, during that period.
2) There is almost no wind from about 5 pm to about 10 pm, almost every day. Solar is decreasing to zero with the setting sun, during that period, which includes the daily peak grid load period.
Wind Systems Paired with Grid-Scale Battery Systems
Wind output is different from other electricity generators, because it is unpredictable and highly variable; its intermittency is not the main problem.
Wind provides desultory energy, MWh, but not reliable capacity, MW.
Reliable capacity is absolutely necessary, sin qua non, for any modern grid system, to match supply to demand, with high precision, at all times.
This article shows the efficiency reduction of the gas turbine generating plants from about 50% with no wind turbines on the grid, to 45.58% with 17% wind, due to counteracting the variable output of wind. See URL
https://www.windtaskforce.org/profiles/blogs/fuel-and-co2-reduction...
Wind Systems Disturbing the Grid: Grid-scale battery systems are increasingly paired with wind systems to reduce the adverse effects on grid stability, due to the variability of wind output, MW.
During gusty wind conditions, the output of a wind system has large variations, which could adversely impact the stability of frequency and voltage of the grid.
For example, a utility, or grid operator, may require a 30 MW wind system have an output variability not exceeding 2 MW/min, up or down, to maintain grid voltage and frequency variations within prescribed ranges. See URL.
The battery systems must be capable of charging and discharging to not exceed those ramp rates, while also not overheating the batteries.
Overheating would shorten the battery useful service life, and may cause fires, that burn at high temperatures and take a long time to extinguish.
Battery systems are rated for delivering a power level of, say 10 MW for 4 hours = 40 MWh, as AC at battery voltage, from 100% full to 0% full; no battery is ever operated at such extremes.
The battery system likely would be about 60 to 70% full, when a wind down ramp would occur.
If a utility allows a maximum 2 MW/minute downward wind ramp.
If it is exceeded, wind output curtailment would be required, by feathering the blades.
The battery discharge would be 2 MW x 3 minutes/60 = 0.6 MWh, if the down ramp lasts 3 minutes.
Roundtrip battery system losses, A-to-Z basis, are about 18% for new li-ion systems, 20% or more, for older systems
The MW and MWh of the battery system would be based on the rated capacity of the wind system, MW
On average, the battery should be charging and discharging to always maintain a certain charge level of charge to be ready for any up and down wind ramp.
In Hawaii, several battery systems caught fire, because they were charging and discharging too rapidly, i.e., they were undersized and/or did not have adequate cooling systems.
NOTE: EV batteries, in case of 1) fast charging at a charging station, 2) fast discharging during accelerating and going uphill, 3) frequent “range driving”, such as make long trips every day (charging to 95%, discharging to 5%, instead of the recommended 80%/20%), all of which would reduce battery life, due to overheating and cell damage; hot summer days and cold winter days are stressful for batteries.
NOTE: This National Renewable Energy Lab, NREL, report mentions above issues. NREL is a government, pro-wind entity, which tends to see wind through rosier glasses than private enterprise.
https://www.nrel.gov/docs/fy14osti/59003.pdf
Solar Systems Paired with Grid-Scale Battery Systems
Variable clouds are the main reason for rapid changes of solar output, in addition to the normal daily cycle. See image
Solar output may decrease by 60% within a few seconds, due to a cloud passing over solar systems.
The time taken for the cloud to pass is dependent upon cloud height, sun elevation and wind speed.
These factors need to be considered regarding solar power output forecasting and integrating the variable output into the grid.
The graph shows solar output profiles for ZIP codes in California. The further north, the less solar.
For example, ZIP code 920 shows a downward spike from about 115 MW to 65 MW, or 50 MW in 10 seconds, or 300 MW/minute, at 1 pm, which would significantly affect frequency and voltage stability on the grid.
For at least a decade, California has been mandating utilities to install grid-scale battery systems on their distribution systems.
The costs of such battery systems are not charged to solar system owners to perpetuate the fantasy “solar is competitive with fossil”
https://www.windtaskforce.org/profiles/blogs/large-scale-solar-plan...

New England Grid Loads
New England power plants, all sources, plus net imports from nearby grids, load about 125 billion kWh/y onto the NE high-voltage grid. That load will be much greater in the future, due to heat pumps and electric vehicles.
Net imports are about 19% of the NE grid load, on an annual basis.
Transmission loss is about 2.5%; electricity to distribution grids is 121.875 billion kWh/y
Distribution loss is about 6.5%; electricity to user electricity meters is 113.953 billion kWh/y
NOTE: The unlabeled vertical axis of the below image is grid load, MW, on the NE grid

Roundtrip Losses of Grid-Scale Battery Systems
Grid-scale battery systems typically are connected to the NE high-voltage grid by step-down and step-up transformers. The below calculations show the electricity drawn from the high voltage grid to charge the battery system, and then discharge the battery system to counteract a one-day wind/solar lull.
We make the following assumptions:
1) Greatly increased wind and solar connected to the NE grid at a future date, such as: wind onshore at 12.5%, wind offshore at 12.5%, and solar at 25% of annual grid load, a total of 50%, or 125/2 = 62.5 TWh/y, or 0.171 TWh/d
The required installed wind/solar nameplate capacities would be:
Wind onshore = 0.125 x 125 TWh/y / (8766 h/y x 0.29, capacity factor) = 6,146 MW; existing about 1450 MW, at end 2021
NE has high project costs/MW, about $2,600 in 2019, and low CFs, which means high costs/kWh. See page 42 of URL
https://www.energy.gov/sites/default/files/2022-08/land_based_wind_...
Wind offshore = 0.125 x 125 TWh/y / (8766 h/y x 0.45, CF) = 3,961 MW; existing about 30 MW, at end 2021
Solar = 0.25 x 125 TWh/y / (8766 h/y x 0.15, CF) = 23,766 MW, existing about 5,500 MW, at end 2021
2) Lull Conditions: Wind/solar output at 15% of their annual average grid load, during a wind/solar lull lasting 24 hours
Wind/solar loaded onto the NE grid would be 0.15 x 0.171 = 0.02568 TWh/d
Wind/solar shortfall would be 0.171 – 0.02568 = 0.14555 TWh/d
3) Grid-scale battery systems, connected to the HV gird, provide the entire shortfall, in TWh/d
Step-by-Step Calculations of Battery System Losses, A-to-Z basis
1) Fed to HV grid via step-up transformer 0.14555, as AC, to make up the above shortfall
Step-up transformer loss at 1%.
From back-end power electronics, as AC, to step-up transformer 0.14700
2) Back-end power electronics loss at 3.5%
From battery to back-end power electronics 0.15215, as DC
3) Battery discharge loss at 4%
Deduction from battery charge 0.15823, as DC
4) Battery charge loss at 4%
From front-end power electronics to battery 0.16456, as DC
5) Front-end power electronics loss at 3.5%
From step-down transformer to front-end power electronics 0.17032, as AC
6) Step-down transformer loss at 1%
Drawn from HV grid via step-down transformer 0.17203, as AC
Battery System Loss, A-to-Z basis
About 0.17203/0.14555 x 100% = 18.2% more needs to be drawn from the HV grid to charge the battery systems up to about 80% full (preferably many days before any wind/solar lull starts), than is fed to the HV grid by discharge from the battery system to about 20% full; the loss percentage increases with aging. See Note
Battery systems are rated at a level of power, MW, provided for a number of hours, MWh, such as providing 2 MW for 4 hours, 2 MW/8 MWh, as AC at battery voltage, which needs to be stepped up to HV voltage.
NOTE: The 18.2% includes battery and power electronics, and step-up and step-down transformer losses. Not included are:
1) thermal management of batteries and enclosures, 2) control and monitoring, 3) battery system aging, and 4) site lighting, O&M, surveillance, etc.
https://www.windtaskforce.org/profiles/blogs/high-costs-of-wind-sol...
Peak Grid Loads on the NE Grid During Wind/Solar Lulls
Electricity loaded onto HV grids, such as by power plants, and electricity drawn from HV grids, such as by utilities, are monitored/recorded by ISO-NE
User electricity consumption is monitored by utilities for billing purposes
Peak grid load on the NE grid occurs when the highest quantity of electricity is consumed in a single hour.
The grid, by itself, does not store any electricity
Electricity moves, as electro-magnetic waves, at near the speed of light; electrons vibrate in place at 60 cycles/second.
ISO-NE, the grid operator, must ensure NE has more than sufficient power resources to provide the peak load.
The below chart shows the days with the highest loads, MW, on the NE grid, ever since ISO-NE began managing the grid in 1997.
https://www.iso-ne.com/about/key-stats/electricity-use/
Peak loads on winter days are about 5000 MW less than on summer days
Peak loads on winter weekends are about 3000 MW less than on summer weekends
Summer peak loads occur during late-afternoon/early-evening, when solar output, MW, has become minimal, and winds typically are minimal as well, according the ISO-NE minute-by-minute operating data, i.e.,
- The wind/solar MW loaded onto the NE grid is almost always minimal during peak demand hours.
- Almost the entire peak load has to be provided by other plants, such as oil, gas, oil/gas CCGT, coal, hydro, tree-burning, nuclear, miscellaneous, and net imports.
The gas/oil CCGT plants likely would be highly efficient, up to 60%, combined-cycle, gas-turbine plants, CCGTs
The tree burning plants, mostly in Maine, have an efficiency of 25%, i.e., the energy equivalent of 3 out of 4 trees is wasted
The NE hydro plants are mostly about 80 years old. Almost all of them are run-of-river plants (no/minimal reservoirs), with high outputs in Spring and low outputs in Summer and early-Fall
The miscellaneous plants are farm methane, burning municipal waste, etc.
Burning municipal waste is the epitome of bad manners, spewing high concentrations of CO2, and various toxic pollutants,
including dioxins, per kWh, far in excess of modern coal power plants, which are up to 43% efficient.
The net imports are from nearby grids.
The CO2 of imported electricity is charged to the jurisdiction of origin, i.e., not to New England, per EPA and UN standards.
Annual Averages are Deceptive During Peak Load Conditions
These sources, during a summer peak load of 27,500 MW (see below image), with an almost-daily wind/solar lull during late-afternoon/early-evening, would have to provide electricity at a rate of 27,500 MW x 8766 h/y x 0.75 capacity factor (assumed) = 181 TWh/y, which would be 181/125 = 1.45 times greater than the annual average load onto the NE grid.
The annual average loading rate is 125/365 = 0.3425 TWh/d
A peak loading rate could be 181/365 = 0.4990 TWh/d
The "nameplate rating", MW, of the NE sources connected to the NE grid would be about 32,500 MW (includes reserves), because many NE plants do not, or cannot, operate at "nameplate rating" during peak demand hours. See Note.
NOTE: The MW of unreliable, weather-dependent, wind and solar are not included in the 32,500 MW
They would be irrelevant, because they typically are minimal during the peak hours of late-afternoon/early-evening.
New England Importing More Electricity from Quebec
Massachusetts and Maine are aiming to build high voltage, direct current, HVDC, transmission lines from Quebec, via Maine and New Hampshire, to Massachusetts.
The Quebec hydro plants, onshore and offshore wind systems in Maine, and offshore wind systems in Massachusetts would be connected to the lines.
The Quebec hydro plants would counteract most of the variations of NE wind output, 24/7/365
The Norway hydro plants have been counteracting most of the variations of Danish and German wind output for decades.
The ISO-NE is hoping this set-up would reduce the need for gas/oil-fired CCGT plants, as part of its "Deep-Decarbonization" scenario.
However, the imported Quebec electricity, and counteracting services, may not be available to New England, due to:
1) A major ice storm affecting transmission,
2) The electricity being needed by Quebec, as California found out during a major US southwest heat wave, when nearby states sent no electricity to California. This scenario is playing out in Europe in 2022, with Norway and France not sending electricity to Germany. This could happen in NE in the future.
2021 Economic Study: Future Grid Reliability Study Phase 1: This ISO-NE report regarding high annual percentages of wind and solar on the NE grid, at some future date, does not mention the reliability of multi-day wind/solar lulls during winter and summer, which occur in New England, multiple times per year. See Appendix
https://www.iso-ne.com/static-assets/documents/2022/07/2021_economi...
Consecutive Wind Lulls in Germany: The below image shows German generation, by source, during a multi-day wind/solar lull in Germany, followed by another multi-day lull, a few days later. The first lull lasted about 100 hours, the second about 50 hours. Germany exported electricity, mostly to Norway, during almost all hours of the 16-day period, to maintain grid stability.
Such wind/solar lull events happen in New England as well.
https://www.windtaskforce.org/profiles/blogs/wind-and-solar-energy-...

Two Wind/Solar Lulls in Germany in 2020: The below image shows German wind/solar generation was about 2000 MW, while the grid load was about 57000 MW, during late-afternoon/early-evening, on April 23, and again during the early morning of April 26.

Germany: Anti-fossil protests by “leave-it-in-the-ground" people caused politicians to force the closing of some of the traditional oil, gas, and nuclear plants.
However, these plants, and their energy supplies, are needed every day, as the misled German people are finding out much to their physical and financial discomfort.
Additional hot water and gas supply curtailments, and extremely high energy prices, will further increase their discomforts during the coming winter.
Barge traffic on the Rhine River has been partially stopped/restricted, because of low water, which will not be offset until about February/March, 2023.
Normally, Germany imports electricity from France and Norway, but both have a lack of water in reservoirs and rivers, that prevents cooling of French nuclear plants, and requires reduced operation of Norwegian hydro plants.
https://www.windtaskforce.org/profiles/blogs/german-electricity-pri...
Norway: Norway, 90% hydro, 10% wind, trying to be a good EU neighbor, produced too much hydro-electricity for export to Germany, etc., in early 2022.
This has resulted in low-reservoir levels, especially in the southern part of Norway, further worsened by less-than-normal meltwater and a West European drought.
The reservoirs will not begin to refill until about February/March, 2023.
Norwegian electricity exports have been stopped.
Norway likely will have at least 80% hydro and 20% wind, in the near future, which would ease water shortage problems, if net electricity exports were not increased.
Norwegian household electric rates have been "administratively" increased to extremely high levels, from 12 c/kWh to about 40 c/kWh, in the southern part of Norway, which has 80% of the population, to discourage consumption and save reservoir water.
The UK, France, Germany, Italy, etc., likely will be in a recession by end 2022.
ISO-NE Daily Dashboard
The dashboard shows the:
System Load Graph
It shows the real-time grid load, MW. Hovering shows the data.
If you click on the rectangle, you get the spreadsheet showing the contribution, MW, by source, on a minute-by-minute basis
If you click on the date, type in a different date, you get the spreadsheet for that date.
Spreadsheets can be obtained for any day of 2022, or any prior year. See URL
https://www.iso-ne.com/isoexpress/web/charts
Circular Fuel Source Mix Chart
It shows a snapshot, of one particular time, of the real-time contribution to grid load, by source, %
Imports from nearby grids are not shown
Here is an example during a typical peak grid load period in summer.
The Dashboard showed the following sources and their loads on the NE high-voltage grid on August 5, 2022, at 6:37 pm, in the middle of the peak grid load period.
The wind and solar contributions were minimal, as usual
Wind was only 112 MW from an installed capacity of about 1450, onshore + 30, offshore = 1480 MW
Solar was only 57 MW from an installed capacity of about 475 MW on the NE high-voltage grid
NOTE: ISO-NE estimated, on August 4, 2022, at 12:30 pm: 1) Solar on distribution grids at 3,858 MW; 2) Solar on the NE high-voltage grid at 452 MW
The next day, both were minimal at 6:37 pm, during peak grid load hours. See Table 1
NOTE: If NE had installed 5 times the present wind/solar capacity, these values would be about 5 times as much, still of no consequence, compared to the grid load of 20,304 MW at 6:37 pm.
The reality is, the other generators, plus net imports, provided almost all of the grid load.
Table 1/Source
|
MW
|
%
|
Natural Gas
|
14505
|
71.48
|
Nuclear
|
3336
|
16.43
|
NE Hydro; pre-existing
|
1722
|
8.48
|
Solar on high-voltage grid
|
57
|
0.28
|
Wind on high-voltage grid
|
112
|
0.55
|
Wood burning; 25% eff; pre-existing
|
196
|
0.96
|
Municipal refuse burning; pre-existing
|
303
|
1.49
|
Methane gas from landfills
|
35
|
0.17
|
Other
|
38
|
0.18
|
Total
|
20304
|
100.02
|
Improved Fuel Mix Chart Not Published for Political Reasons
ISO-NE provides the MW contribution of each source on a five-minute basis. Here is the image for August 4, 2022. This grid load graph reflects the impact of distributed solar systems connected to distribution grids, as discussed below.
The below graph, prepared by Warren Van Wyck, shows the NE grid is greatly dependent on natural gas, nuclear and imports from nearby grids, and on NE hydro during peak hours.
Any attempt to curtail them, and their energy supplies, would be an-off-the-charts folly

The graph, with MW on the vertical axis and time on the horizontal axis, clearly reveals what happened during a 24-h period.
- Imports from nearby grids, white band at the top, are a significant part of the grid source mix.
- Oil, dark gray, was used during peak demand hours to reduce gas consumption.
- HV grid-connected solar, yellow, was just a sliver of the total load during peak hours.
- Wind, dark brown, was just a sliver of the total load during peak hours
- NE hydro, blue, was maximal during peak hours, because owners saved water all day, so they could maximize output during peak hours, and get paid the highest c/kWh.
- Nuclear maintained a steady output, rain or shine, wind or no wind.
- Natural gas, light blue, provided the most contribution to the grid load, BY FAR.
Without natural gas, the NE economy, and its people, would be in big trouble, similar to Germany, a major wind/solar maven, which is desperately scrambling to replace Russian gas with gas from various other sources.
- Natural gas wholesale pricing, Dutch TTF, increased by about a factor of 5 in Europe, to $221/MWh = $65/million Btu, on August 15, 2022, due to sanctions backfiring; a MWh = 3.412 million Btu
- Natural gas wholesale pricing increased by about a factor of 3 in the US, to $8.77/million Btu, on August 15, 2022, due to Biden exporting our oil, gas and coal.
THE ABOVE GRAPH DOES NOT SHOW THE SOLAR OUTPUT ON DISTRIBUTION GRIDS; 3,858 MW, AT ABOUT NOONTIME, ON A SUNNY DAY
See Note and next section
NOTE: Here's the link to interactive graph of fuel mix for August 4, 2022, which shows the ISO-NE-estimated solar output on distribution grids from rooftops, meadows, etc.; thin line at the bottom.
Graph by Warren Van Wyck
That power is not fed into the NE high-voltage grid, i.e., it stays on distribution grids.
This is a new power source that has grown over the past 15 years.
It is complementary to the power sources connected to the NE high-voltage grid.
Together they serve the electrical requirements (MW and MWh) of the New England economy.
If that complementary output had not been there, such as on an overcast/rainy day, the power sources connected to the NE high-voltage grid would have to increase there outputs.
The Improved Fuel Mix Graph, would use the same data, but would show what happened during 24 hours
ISO-NE likely has Real-Time Improved Fuel Mix Charts, including for the most stressful days, but they are not made public, because they would clearly show wind and solar could not be relied on throughout the year, at peak load periods, which, if revealed to the general public, would rain on the highly subsidized wind/solar parade.
It is well-known, wind and solar provide electricity at random, not when it is needed to help out during stressful days, especially during peak grid load periods.
An additional big question remains. What part of the peak electricity loaded onto the grid, MW and MWh, would need to be provided by grid-scale battery systems on stressful days, and on all other days?
Solar Systems Connected to Distribution Grids
The output of these solar systems is seen by ISO-NE as a reduction in grid load.
It is often called "behind-the-meter", i.e., invisible to ISO-NE
ISO-NE estimates the reduction, based on solar conditions throughout New England, for planning purposes, each day.
Here is an example:
May 1, 2022, was a rare, very sunny day all over New England. There was an installed AC capacity of about 5,000 MW of distributed solar systems on rooftops and meadows, etc., of which about 2700 MW in Massachusetts, 900 MW in Connecticut, and 475 MW in Vermont. That capacity generated a maximum of about 4000 MW AC, around noontime. See URL
https://www.euci.com/new-england-hits-a-record-low-in-electricity-d...
The below image shows the NE grid load graph for May 1, 2022, with and without solar on distribution grids.
Graph by Warren Van Wyck
The grid load was about 7,580 MW, around noontime, with solar.
The grid load would have been about 7580 + 4000 = 11,500 MW, around noontime, without solar.
Daily down/up ramping is performed mostly by the flexible, quick-reacting, gas/oil-fired CCGT plants. Those plants also ramp up and down to counteract the random output variations of wind, 24/7/365.
Those CCGT plants, often vilified, because they are "fossil", in fact, they are the unsung heroes that make it possible for wind and solar to even exist on the grid.
NOTE: Up/down ramping, at part-load, of CCGT power plants is inefficient and more expensive.
They have more Btu/kWh, more CO2/kWh, more wear-and-tear/kWh, i.e., more cost/kWh, just as a car in urban traffic.
That extra expense is not charged to solar system owners, but "absorbed" by CCGT plant owners and ratepayers.
NOTE: When the Irish grid had a minor connection to the UK grid, the CCGT plants, instead of operating at about 50% efficiency without wind, operated in counteracting mode at only 42% efficiency with 17% wind, due to increased part-load and start/stop operation. See URL.
https://www.windtaskforce.org/profiles/blogs/fuel-and-co2-reduction...
NOTE: The CCGT plants would have to provide much greater loads to the NE high-voltage grid on rainy, overcast days, and on days with snow/ice on the panels, because solar on distribution grids would be minimal.
NOTE: None of the solar on distribution grids is transmitted to the NE high-voltage grid. All of it is consumed by users on the distribution grids for their heat pumps, air conditioners, electric vehicles, etc.

SUPPLEMENTARY ARTICLES
NEW ENGLAND
By the way, all of this, including rolling blackouts at ZUB-ZERO temperatures, and a lack of gas and oil for space heating, applies to New England, if:
1) New York State keeps obstructing new gas pipelines from Pennsylvania to New England; THIS SHOULD BE LEGALLY FORBIDDEN AS AN UNCONSTITUTIONAL INTERFERENCE OF INTER-STATE COMMERCE, and
2) The New England oil, gas and coal storage capacities near power plants are not increased by at least 100% to ensure RELIABLE ELECTRICAL SERVICE IN WINTER, WHICH WOULD BE ESPECIALLY IMPORTANT, IF UNCERTAIN, MOTHER-NATURE, WEATHER-DEPENDENT WIND AND SOLAR WERE FURTHER EXPANDED, AS THE US AIMS TO BLINDLY COPY THAT DISASTROUS EUROPEAN SCENARIO
These articles and image are provided for reference.
.
ISO-NE REPORT OF 2021 ECONOMIC STUDY: FUTURE GRID RELIABILITY STUDY PHASE 1
https://www.iso-ne.com/static-assets/documents/2022/07/2021_economi...
DEEP DIVE SUMMARY OF THE ISO-NE REPORT
https://www.utilitydive.com/news/new-england-future-grid-study-iso/...
LIFE WITHOUT OIL
Life without oil means many products that are made with oil, such as the hundreds listed below, would need to be provided by wind and solar and hydro.
Folks, including Biden's attendants, wanting to get rid of fossil fuels, such as crude oil, better start doing some rethinking.
The above also applies to natural gas, which is much preferred by many industries
If you do not have abundant low-cost energy, you cannot have modern industrial economies.

APPENDIX 1
These articles contain significant information regarding wind, solar and grid-scale battery systems
GRID-SCALE BATTERY SYSTEMS IN NEW ENGLAND TO COUNTERACT SHORTFALL OF ONE-DAY WIND/SOLAR LULL
https://www.windtaskforce.org/profiles/blogs/grid-scale-battery-sys...
COLD WEATHER OPERATION IN NEW ENGLAND DECEMBER 24, 2017 TO JANUARY 8, 2018
https://www.windtaskforce.org/profiles/blogs/cold-weather-operation...
ANALYSIS OF WIND AND SOLAR ENERGY LULLS AND ENERGY STORAGE IN GERMANY
https://www.windtaskforce.org/profiles/blogs/wind-and-solar-energy-...
IRELAND FUEL AND CO2 REDUCTIONS DUE TO WIND ENERGY LESS THAN CLAIMED
https://www.windtaskforce.org/profiles/blogs/fuel-and-co2-reduction...
BATTERY SYSTEM CAPITAL COSTS, OPERATING COSTS, ENERGY LOSSES, AND AGING
https://www.windtaskforce.org/profiles/blogs/battery-system-capital...
HIGH COSTS OF WIND, SOLAR, AND BATTERY SYSTEMS IN US NORTHEAST
https://www.windtaskforce.org/profiles/blogs/high-costs-of-wind-sol...
APPENDIX 2
These articles explain a lot about the world-wide “Climate Crisis” scam, based on highly compromised surface station measurements, which typically read HIGH.
Climate scientists SUBJECTIVELY adjust the readings for use in their SUBJECTIVE computerized-temperature-calculation programs, which are used in the reports of IPCC, etc., for scare-mongering purposes.
New Surface Stations Report Released – It’s ‘worse than we thought’
https://www.windtaskforce.org/profiles/blogs/new-surface-stations-r...
Weather- Just how does it happen?
https://www.windtaskforce.org/profiles/blogs/weather-just-how-does-...
A summary of the results of three “Physics of the Earth’s Atmosphere” papers, which were submitted for peer review at the Open Peer Review Journal.
https://globalwarmingsolved.com/2013/11/19/summary-the-physics-of-t...
APPENDIX 3
Satellites and balloons measure temperatures of the Troposphere, which starts at ground level, and has an average height of 59,000 ft at the tropics, 56,000 ft at the middle latitudes, and 20,000 ft at the poles. Above those levels starts the Stratosphere.
Balloons directly measure temperatures. Satellites measure radiation, from which temperatures are calculated.
Both consistently measure much lower temperatures than the average of 102 computer-generated graphs.
See Appendix 2 and 3
The data in the below images is for a 43-y period.
There is global warming, but it is not anywhere near as much as scare-mongers are claiming.
https://www.windtaskforce.org/profiles/blogs/grid-scale-battery-sys...
1) Objective satellite and balloon temperatures increased from 0.00 to 0.5 C, or, or 0.116 C/decade
2) Subjective computer-generated temperatures increased from 0.00 to 1.20 C; or 0.28 C/decade, about 2.7 TIMES AS FAST
The temperature data by satellites and balloons are more accurate than land-based measurements.
See Appendix 2 and URL
https://en.wikipedia.org/wiki/UAH_satellite_temperature_dataset
Satellite measurements are made many times during every day and systematically cover almost the entire world; +/- 85-degree latitude.
The satellite data is vastly more complete, and accurate than would be gathered by ground stations. (See Appendix 2)
Balloon measurements, made on a sampling basis, are vastly less complete than satellite measurements, but they serve as a useful crosscheck on the satellite measurements.
NOTE: Behind the 102 computer graphs are hundreds of organizations that likely receive a significant part of their revenues from governments and subsidy-receiving wind, solar, battery, etc., businesses.
The livelihood and career prospects of the people creating these graphs is more secure, if they aim high, rather than low.
https://www.scienceunderattack.com/blog/2021/2/22/latest-computer-c...

A more detailed view of satellite temperatures.

APPENDIX 4
Science and Environmental Policy Project (SEPP) and also a member of the CO2 Coalition. Sheahen and the Coalition are collaborating on a brief.
SEPP’s October 8 newsletter contains a summary of a major 2021 paper by Happer and co-author William van Wijngaarden that completely undermines the fake “science” the IPCC and EPA used to support the case of climate alarm.
Sheahen specifically discusses the efforts of Professors William van Wijngaarden and William Happer in their pioneering work in calculating the real-world Global Warming Potentials (GWPs) of the five most common Green-House Gases (GHGs).
Sheahan explains why the approach used by IPCC is faulty, but nonetheless used by its followers, such as the US National Center for Atmospheric Research (NCAR) and the EPA.
These faulty methods lead to great exaggeration of the greenhouse effect of carbon dioxide, methane, and other minor greenhouse gases. . . .
Sheahan shows the stunning agreement between the calculations of van Wijngaarden and Happer (W & H) with satellite measurements (and balloon measurements) of outgoing infrared radiation emitted by the earth to space . . .
Sheahan claims, because of the exceptionally good agreement between observational data and the calculations of W & H, we can conclude the W&H model has been validated.
The W&H model embodies the scientific method.
In that case, it is reasonable to use it to study other hypothetical cases.
It is not possible to do so with IPCC models, which have never achieved agreement with observations. . .
See Appendix 3
The gist of the H&W work is the greenhouse effect of CO2 in the atmosphere is almost entirely saturated, such that any additional CO2 can have almost no additional warming effect.
Here is a chart prepared by Sheahan to illustrate the H&W results.
As atmospheric CO2 increases, say from 380 to 420 ppm, it has less warming effect.
The most warming effect occurs at very low levels of CO2, say 20 to 60 ppm.

APPENDIX 5
A timely and important new paper has just been uploaded to the CO2 Coalition website on nitrogen.
The first half of the paper on the greenhouse warming effect of N2O is quite technical
It is summarized in the first link.
Link to the full paper is at the bottom. Please distribute widely.
Authors: Will Happer, C. A. de Lange, William Wijngaarden and J.D. Ferguson
Nitrous Oxide and Climate – Why restricting N2O emissions is unnece...
Nitrous oxide (N20) has now joined carbon dioxide (CO2) and methane (CH4) in the pantheon of “human-generated demon” gases.
GW scare-mongers view increasing concentrations of these molecules are leading to unusual and unprecedented GW, which will lead to catastrophic consequences for both our ecosystems and humanity.
Countries around the world are in the process of greatly reducing, or eliminating, the use of nitrogen fertilizers, based on heretofore poorly understood properties of nitrous oxide.
Reductions of N2O emissions of 40 to 45 percent are being proposed in Canada , and by up to 50 percent in the Netherlands .
Sri Lanka’s complete ban on fertilizer in 2021 led to the total collapse of their primarily agricultural economy.
The CO2 Coalition has published this paper, which evaluates the GW effect of the N20 and its role in the nitrogen cycle.
Policymakers can now proceed to make informed decisions about the costs and benefits of mandated N20 reductions of this beneficial molecule.
This new paper joins previous CO2 Coalition reports on other greenhouse gases, carbon dioxide and methane.
Key takeaways from the paper:
- At current rates, a doubling of N2O would occur in more than 400 years.
- Atmospheric warming by N2O is estimated to be 0.064 C per century.
- Increasing crop production requires continued application of synthetic nitrogen fertilizer to feed a growing population.
Download the entire PDF Nitrous Oxide
It is dangerous to be correct in matters, where established men are wrong, by Voltaire
You need to be a member of Citizens' Task Force on Wind Power - Maine to add comments!
Join Citizens' Task Force on Wind Power - Maine