BATTERY SYSTEM CAPITAL COSTS, OPERATING COSTS, ENERGY LOSSES, AND AGING-r
BATTERY SYSTEM CAPITAL COSTS, OPERATING COSTS, ENERGY LOSSES, AND AGING
https://www.windtaskforce.org/profiles/blogs/battery-system-capital...
By Willem Post
.
Solar electricity increases with the rising sun, is maximal around midday, and decreases with the setting sun.
Electric grids with many solar systems have major midday solar output bulges, that are counteracted/balanced by traditional power plants reducing their outputs. Combined-cycle, gas-turbine plants, CCGTs, perform almost all of the counteracting/balancing of the variable wind and solar outputs.
Those plants have to increase their outputs during the peak hours of late afternoon/early evening, when solar and wind usually are minimal; solar will have gone to sleep until about 9 AM the next morning.
Owners of counteracting/balancing plants, to avoid grid overload, are required by ISO-NE, the NE grid operator, to counteract the midday solar bulge, i.e., reduce their outputs, which decreases their annual production, kWh/y, increases their costs, c/kWh, plus increases wear and tear of their plants.
ISO-NE compensates the Owners of these plants, and charges utilities as part of “grid charges”, plus mark-up.
The utilities charge ratepayers, plus mark-up. Nothing is “for free”
Battery Systems Electricity Delivery Periods at Rated Capacity
Battery systems have rated capacity outputs, MW, and rated energy delivery, MWh. Most recently installed battery systems have about 4 hours of electricity delivery, MWh, at rated capacity, MW, because those battery systems are primarily used to absorb midday solar output bulges.
Battery systems, in use during all of 2015, delivered electricity, on average, for 0.5 hours
Battery systems, in use during all of 2018, delivered electricity, on average, for 2.4 hours
Battery systems, in use during all of 2019, delivered electricity, on average, for 3.2 hours
The increase in energy-delivery duration is required, because the main function of battery systems is to store excess wind and store midday solar output bulges. They discharge about 80% of the stored electricity during the peak hours of late afternoon/early evening; the other 20% are round-trip battery system losses.
https://www.eia.gov/todayinenergy/detail.php?id=43775
Battery Systems Perform Multiple Services at the Same Time
A 2018 survey of 43 battery systems, performed by the Energy Information Administration, EIA, found:
26 systems dealt with: 1) excess wind events, which occur at random, and 2) midday solar output bulges, which occur every day
18 dealt with frequency regulation
13 dealt with system peak demand shaving
The annual battery throughput is greatest, by far, for dealing with excess wind and midday solar output bulges.
.
.
Round-Trip Losses of Battery Systems
Because of round-trip losses, batteries are a net consumer of electricity. Of the 150 battery plants (1,022 MW) that reported operating battery storage capacity on Form EIA-860 in 2019, 109 plants (850 MW) also reported electricity discharge and charge data on Form EIA-923 in 2019.
These 109 plants, using a mix of storage technologies, including li-ion, reported a gross discharge of 458,169 MWh, and a gross charge of 553,705 MWh, in 2019; for an average AC-to-AC round-trip loss of 20.85%, as measured from inlet to front-end power electronics, through battery, to outlet of back-end power electronics.
Losses of various storage technologies range from about 35% to less than 20%, for an average of 20.85%; that average has decreased, due to the increased use of li-ion batteries.
The 20.85% excludes electricity consumption of: 1) thermal management of batteries and enclosures, 2) control and monitoring, 3) step-up and step-down transformers, 4) site lighting, O&M, surveillance.
That electricity often is not reported. It may be measured by separate meters.
NOTE: Li-ion battery systems, because of mass production by Tesla and others, have lesser costs per kWh delivered as AC, and lesser percent losses relative to other technologies.
Since about 2017, li-ion systems have become a major part of the US storage system inventory. See Part 4
Battery System Usage Usually Less than 10%
Usage is the percent of rated energy delivery, MWh. The highest usage level is:
1) Charging when wholesale prices are low and discharging when they are high, so-called arbitrage,
2) Charging during midday, when solar output surges, and discharging during the peak hours of late afternoon/early evening. Here are some EIA examples:
1) About 230,000 MWh of the gross discharge in the PJM area was for frequency regulation (Figure 10 in URL).
The PJM battery systems have a usage factor of almost 9%
2) About 110,000 MWh of the gross discharge in the CAISO area was for excess wind and solar storage.
The CAISO battery systems have a usage factor of just over 9%
3) The ISO-NE battery systems have a usage factor of about 5%
See page 20 of URL
https://www.eia.gov/analysis/studies/electricity/batterystorage/pdf...
Multi-day Wind/Solar Lulls
If, at some future date, gas, oil, and nuclear power plants were no longer allowed, and were replaced by wind and solar systems, battery systems would need about a month of electricity delivery to cover:
1) Randomly occurring, 5 to 7-day wind/solar lulls, with mostly minimal output, could be followed by another multi-day wind/solar lull a few days later. The battery systems would be near empty after counteracting the first lull, and likely would not be recharged by wind/solar in a timely manner, to counteract the second lull.
2) Seasonal wind/solar output variations
3) Year-to-year wind/solar output variations of 25 - 30%.
NOTE: The German ENERGIEWENDE target is 80 - 95% of electricity generation from renewables by 2050.
Germany uses 1) connections to nearby grids, 2) fossil fuel standby/backup plants for counteracting/balancing most of its wind and solar, especially during sunny and windy days. Large-scale battery storage is deemed too expensive. See URLs.
https://www.thegwpf.org/content/uploads/2017/01/Vahrenholt-Energiew...
https://www.windtaskforce.org/profiles/blog/list?user=0fk5o2ukdpq69
US Utilities Hiding Capital and Operating Cost Data
US Utilities, which own a large number of various technology battery systems, publicize a minimum amount of year-by-year spreadsheet information regarding the:
1) All-in, turnkey capital cost of their battery systems
2) Hourly and daily operating data, including all-in, round-trip losses, and usage for each service.
3) Revenues earned from each service
4) Annual cost of: 1) owner’s income, 2) cost of financing, 3) O&M expenses, 4) all other expenses
5) How much of Owner annual costs is offset by tax credits, depreciation of the entire system in about 5 years, and deduction of interest.
PART 1
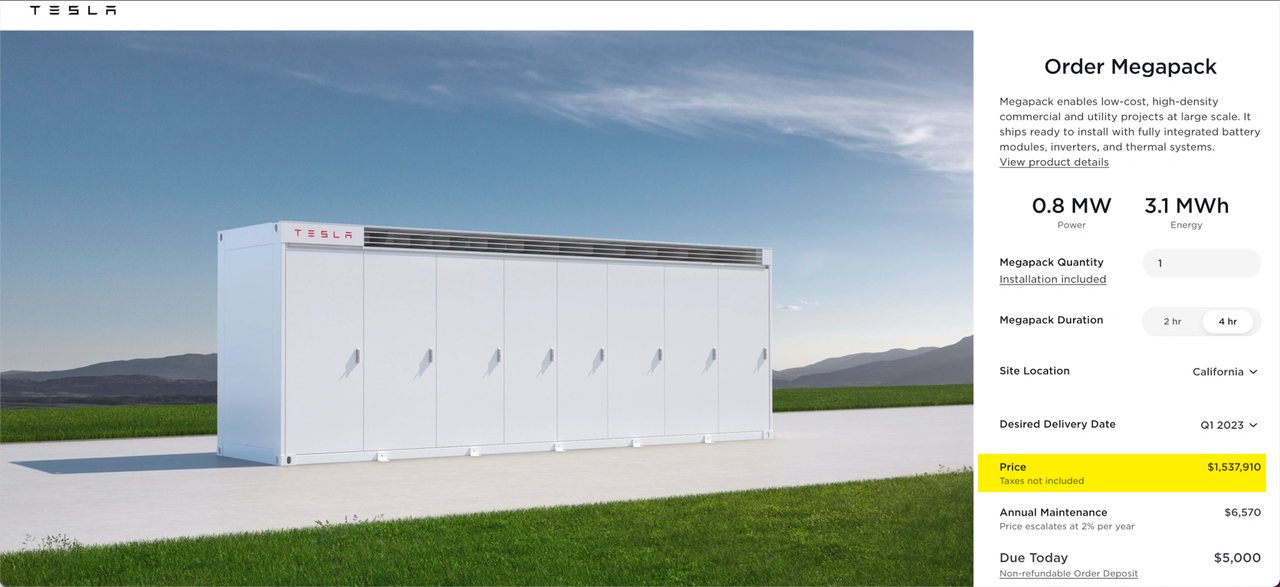
Turnkey Capital Cost of Tesla-Megapack Battery Systems: Tesla is the world’s largest provider of lithium-ion battery systems, that include front-end power electronics, batteries, back-end power electronics, heating and cooling systems for batteries and enclosures
Megapack ratings, MW/MWh, increased from 2021, to 2022, to 2023
Megapack pricing varies due to market conditions
2021 pricing for a 10 Megapack system, 4-h delivery, with installation, about $10 million, or $328/kWh
2022 pricing for a 10 Megapack system, 4-h delivery, with installation, about $16 million, or $412/kWh
2023 pricing for a 10 Megapack system, 4-h delivery, with installation, about $19 million, or $487/kWh
Utility-scale, battery system pricing usually not made public, but for this system it was.
Neoen, in western Australia, turned on its 219 MW/ 877 MWh Tesla Megapack battery, the largest in western Australia.
Ultimately, a 560 MW/2,240 MWh battery system, $1,100,000,000/2,240,000 kWh = $491/kWh, delivered as AC, late 2024 pricing. Smaller capacity systems cost much more than $500/kWh
Tesla Megapacks had a 487/328 = 48.5% price increase from 2021 to 2023: Connecting the Megapacks into a system incurs losses, which are represented by the “Tesla design factor”
After applying the factor, the above $/kWh is increased! See URLs and below examples.
https://electrek.co/2022/03/21/tesla-hikes-megapack-prices-backlog-...
https://www.tesla.com/megapack/design
1) Example of Turnkey Cost of Large-Scale, Megapack Battery System, 2022 pricing
PG&E, a California utility, placed a battery system in operation at Moss Landing in April 2022
The system consists of 256 Megapacks, rated 182.5 MW/730 MWh, 4-h energy delivery.
Power = 256 Megapacks x 0.770 MW x 0.926, Tesla design factor = 182.5 MW
Energy = 256 Megapacks x 3.070 MWh x 0.929, Tesla design factor = 730 MWh
We assume $1.1 million/Megapack, because of large number of units
Estimated supply by Tesla, 256 Megapacks x $1.1 million = $282 million, or $386/kWh
Estimated supply by Ohers, $62/kWh
All-in, turnkey cost about $448/kWh; 2022 pricing
The primary purpose of this battery system is to absorb part of the midday solar peak, and deliver about 80% of it during the peak demand hours of late afternoon/early evening.
Any costs associated with battery systems are charged to ratepayers, taxpayers and added to government debt, i.e., not charged to Owners of solar systems, the grid disturbers.
https://www.10news.com/news/national/pg-es-tesla-megapack-battery-i...
2) Example of Turnkey Cost of Large-Scale, Megapack Battery System, 2023 pricing
The system consists of 50 Megapack 2, rated 45.3 MW/181.9 MWh, 4-h energy delivery
Power = 50 Megapacks x 0.979 MW x 0.926, Tesla design factor = 45.3 MW
Energy = 50 Megapacks x 3.916 MWh x 0.929, Tesla design factor = 181.9 MWh
Estimate of supply by Tesla, $90 million, or $495/kWh. See URL
Estimate of supply by Others, $14.5 million, or $80/kWh
All-in, turnkey cost about $575/kWh; 2023 pricing
https://www.tesla.com/megapack/design
https://cms.zerohedge.com/s3/files/inline-images/2022-03-21_15-28-4...
https://www.zerohedge.com/commodities/tesla-hikes-megapack-prices-c...
Annual Cost of Megapack Battery Systems; 2023 pricing
Assume 45.3 MW/181.9 MWh; turnkey cost $104.5 million; 104,500,000/181,900 = $574/kWh, per Example 2
Amortize bank loan, 50% of $104.5 million, at 6.5%/y for 15 years, $5.484 million/y
Pay Owner return, 50% of $104.5 million, at 10%/y for 15 years, $6.765 million/y (10% due to high inflation)
Lifetime (Bank + Owner) payments 15 x (5.484 + 6.765) = $183.7 million
Assume battery daily usage, 15 years at 10%; loss factor = 1 / (0.9 *0.9)
Battery lifetime output = 15 y x 365 d/y x 181.9 MWh x 0.1, usage x 1000 kWh/MWh = 99,590,250 kWh to HV grid; 122,950,926 kWh from HV grid; 233,606,676 kWh loss
(Bank + Owner) payments, $183.7 million / 99,590,250 kWh = 184.5 c/kWh
Less 50% subsidies (tax credits, 5-y depreciation, loan interest deduction, etc.) is 92.3c/kWh
Subsidies shift costs from project Owners to ratepayers, taxpayers, government debt.
.
Excluded costs/kWh: 1) O&M; 2) system aging, 1.5%/y, 3) loss factor 1 / (0.9*0.9), HV grid-to-HV grid, 4) grid extension/reinforcement to connect battery systems, 5) downtime of parts of the system, 6) decommissioning in year 15, i.e., disassembly, reprocessing, storing at hazardous waste sites. Excluded costs would add at least 15 c/kWh
COMMENTS ON CALCULATION
Almost all existing battery systems operate at less than 10%, see top URL, i.e., new systems would operate at about 92.4 + 15 = 107.4 c/kWh. They are used to stabilize the grid, i.e., frequency control and counteracting up/down W/S outputs. If 40% throughput, 23.1 + 15 = 38.1 c/kWh.
That is on top of the cost/kWh of the electricity taken from the HV grid to charge the batteries
Up to 40% could occur by absorbing midday solar peaks and discharging during late-afternoon/early-evening, in sunny California and other such states. The more solar systems, the greater the midday peaks.
See top URL for Megapacks required for a one-day wind lull in New England
40% throughput is close to Tesla’s recommendation of 60% maximum throughput, i.e., not charge above 80% and not discharge below 20%, to perform 24/7/365 service for 15 y, with normal aging.
Owners of battery systems with fires, likely charged above 80% and discharged below 20% to maximize profits.
Tesla’s recommendation was not heeded by the Owners of the Hornsdale Power Reserve in Australia. They excessively charged/discharged the system. After a few years, they added Megapacks to offset rapid aging of the original system, plus they added more Megapacks to increase the rating of the expanded system.
Regarding any project, Banks and Owners have to be paid, no matter what. I amortized the Bank loan and Owner’s investment
Divide total payments over 15 years by the throughput during 15 years, to get c/kWh, as shown.
Loss factor = 1 / (0.9 *0.9), from HV grid to 1) step-down transformer, 2) front-end power electronics, 3) into battery, 4) out of battery, 5) back-end power electronics, 6) step-up transformer, to HV grid, i.e., draw about 50 units from HV grid to deliver about 40 units to HV grid. That gets worse with aging.
A lot of people do not like these c/kWh numbers, because they have been misled by self-serving folks, that “battery Nirvana is just around the corner”.
.
NOTE: EV battery packs cost about $135/kWh, before it is installed in the car. Such packs are good for 6 to 8 years, used about 2 h/d, at an average speed of 30 mph. Utility battery systems are used 24/7/365 for 15 years
.
NOTE: Aerial photos of large-scale battery systems with many Megapacks, show many items of equipment, other than the Tesla supply, such as step-down/step-up transformers, switchgear, connections to the grid, land, access roads, fencing, security, site lighting, i.e., the cost of the Tesla supply is only one part of the battery system cost at a site.
.
NOTE: Battery system turnkey capital costs and electricity storage costs likely will be much higher in 2023 and future years, than in 2021 and earlier years, due to: 1) increased inflation rates, 2) increased interest rates, 3) supply chain disruptions, which delay projects and increase costs, 4) increased energy prices, such as of oil, gas, coal, electricity, etc., 5) increased materials prices, such as of tungsten, cobalt, lithium, copper, manganese, etc., 6) increased labor rates.
.
BATTERIES IN NEW ENGLAND TO COUNTERACT A ONE-DAY WIND/SOLAR LULL?
https://www.windtaskforce.org/profiles/blogs/batteries-in-new-england
Part 2
All-in Turnkey Cost of Battery System to Offset a Wind Lull of One Day in New England
Here is an estimate, based on greatly increased wind and solar systems tied to the New England high voltage grid, in case of a one-day, wind/solar shortfall to be made up with battery systems.
Typically, grid-scale battery systems are connected to the NE high-voltage grid by step-down and step-up transformers.
The below calculations show the electricity drawn from the HV grid to charge the battery system, and then discharge the battery system to counteract a one-day wind/solar lull.
Assumptions for calculation purposes:
Assumption 1: Future onshore wind at 12.5%, offshore wind at 12.5%, and solar at 25% of NE annual grid load, a total of 50%
Annual grid load from all sources is 125 TWh/y
Annual grid load from 50% wind/solar is 125/2 = 62.5 TWh/y, or 0.17123 TWh/d
The required installed wind/solar nameplate capacities would be:
Wind onshore, 12.5% = 0.125 x 125 TWh/y / (8766 h/y x 0.29, NE capacity factor) = 6,146 MW
Existing onshore wind was about 1450 MW, at end 2021
NE has high turnkey costs/MW, about $2,600 in 2019, and low CFs, which means high costs/kWh. See page 42 of URL
https://www.energy.gov/sites/default/files/2022-08/land_based_wind_...
Wind offshore, 12.5% = 0.125 x 125 TWh/y / (8766 h/y x 0.45, CF) = 3,961 MW
Existing offshore wind was 30 MW, at end 2021
Solar, 25% = 0.25 x 125 TWh/y / (8766 h/y x 0.15, CF) = 23,766 MW DC, or 19,013 MW AC
Existing solar on HV grid and distribution grids (rooftops and meadows, etc.) produced 8,396,000 MWh, in 2021, with about 2,014 MW DC connected to HV grid, and about 4,371 MW DC connected to distribution grids
https://www.iso-ne.com/static-assets/documents/2022/04/final_2022_p...
https://isonewswire.com/2022/01/31/amounts-sources-of-electric-ener...
Assumption 2: Wind/solar output at 15% of their annual average grid load during a wind/solar lull lasting 24 hours
Wind/solar loaded onto the NE grid during a lull would be 0.15 x 0.17123 = 0.02568 TWh/d
Wind/solar shortfall would be 0.17123 – 0.02568 = 0.14555 TWh/d. See table
Assumption 3: Grid-scale battery systems, connected to distribution and HV girds, provide the entire shortfall, in TWh/d
NE grid load, TWh/y |
125 |
125 |
125 |
125 |
125 |
125 |
125 |
125 |
d/y |
365 |
|||||||
NE grid load, TWh/d |
0.34247 |
|||||||
2021 |
2021 |
Future |
Future |
Future |
2021 |
Future |
Future |
|
Wind |
Wind |
Wind |
Wind |
Wind |
Solar, DC |
Solar, DC |
Wind/Solar |
|
onshore |
offshore |
onshore |
offshore |
|||||
Installed, MW |
1450 |
30 |
6146 |
3961 |
10107 |
23766 |
||
Production, BTM, MWh/y |
5748000 |
|||||||
Production, HV grid, MWh/y |
2648000 |
|||||||
h/y |
8766 |
8766 |
8766 |
8766 |
8766 |
|||
Capacity factor |
0.29 |
0.45 |
0.29 |
0.45 |
0.15 |
|||
Percent of grid load |
2.949 |
0.095 |
12.500 |
12.500 |
25.000 |
6.717 |
25.000 |
50.000 |
Production, MWh/y |
3686103 |
118341 |
15625000 |
15625000 |
31250000 |
8396000 |
31250000 |
62500000 |
TWh/d |
||||||||
Wind/Solar, normal |
0.17123 |
|||||||
Wind/Solar, if lull |
0.15 |
0.02568 |
||||||
Wind/Solar, shortfall |
0.14555 |
Step-by-Step Battery System Losses: The below calculation shows the step-by-step losses of battery systems, A-to-Z basis
AC-to-AC battery system losses (new system) |
TWh |
Drawn from HV grid, AC |
0.17125 |
Through step-down transformer, AC, 1% loss |
0.16954 |
Through power electronics, DC, 3.5% loss |
0.16360 |
Charge added to battery, DC, 3.5% loss |
0.15788 |
Charge drawn from battery, DC, 3.5% loss |
0.15235 |
Through power electronics, AC, 3.5% loss |
0.14702 |
Through step-up transformer to HV grid, AC, 1% loss |
0.14555 |
Loss = 100 x 0.17125/ 0.14555, % loss |
17.7 |
.
Battery System Loss, A-to-Z basis
17.7%, plus other losses, which are: 1) thermal management (HVAC) of batteries and enclosures, 2) control and monitoring, 3) site lighting, O&M, surveillance. Those losses, usually not mentioned, are 2 to 4%, more in cold and hot climates.
.
All-in Turnkey Cost of Battery System to for a One-Day Wind Lull
At a future date:
Installed onshore/offshore wind systems would be 10,107 MW AC to provide 25% of NE grid load
Installed solar systems would be 23,766 MW DC to provide 25% of NE grid load
Wind annual average output would be 31,250,000 MWh/y x 1/8,766 h/y = 3,565 MW
Wind capacity factor 3565/10107 = 0.353
For analysis purposes:
1) Wind MW is assumed to become 0.15 x 3565 = 535 MW, during a one-day wind lull
2) Tesla recommends normal battery operation within 20% full to 80% full, to achieve a 15-y useful service life. We assume the batteries are at 70% full at start of wind/solar lull, and maximum drawdown is to an abnormal 10% full, for a 0.6 available capacity.
3) A more exact analysis would be on an hour-to-hour basis, instead of annual average basis
Required Megapacks: At least (3565 – 535) MW x 0.770 MW/Megapack x 1/0.6, available capacity x 1/0.926, Tesla design factor = 7,083 Tesla, 4-h Megapacks, arranged in parallel to obtain the desired MW
Each parallel train would have (10) 4-h Megapacks, arranged in series to obtain 10 x 4 x 0.6 = 24-h service
A total of 7083 x 10 = 70,830 Megapacks would offset a one-day wind lull
BTW, this assumes only batteries would offset the wind lull, i.e., no output from other power plants would be available.
Supplied by Tesla (7,083 x 10) Megapacks x $1.1 million each = $77.913 billion
Supply by Others $9,817 billion. See Part 1
All-in, turnkey cost about $77.913 b + $9.817 b = $87.729 billion, for a one-day wind lull
Battery Systems to Deal with Midday Solar Output Surge
A separate battery system, consisting of several thousand 4-h Megapacks, arranged in parallel, would be needed almost every day, to absorb a part of the MW and MWh of the midday solar surge, because that surge from 23,766 MW DC of solar systems likely would exceed midday demand; the alternative would be to export it to nearby grids, as Germany does to nearby countries.
After round-trip losses of about 20%, the battery systems would discharge the remaining 80% during the peak hours of late-afternoon/early-evening
PART 3
Five Sources to Corroborate Round-Trip Losses of Grid-Scale Battery Systems
Per EIA, the average round-trip loss of grid-scale battery systems was 15%, as measured at inlet to front-end AC to DC power electronics, through battery, to outlet of back-end DC to AC power electronics.
This excludes: 1) thermal management of batteries and enclosures, 2) control and monitoring, 3) step-up and step-down transformers, 4) site lighting, O&M, surveillance. That electricity often is not reported. It may be measured by separate meters. That electricity would increase round-trip losses to at least 19% for new systems, greater than 20% for older systems. Here are four sources that document losses:
Source 1, based on measured data, A-to-Z basis
This article identifies 18 losses of a stationary battery system, totaling about 20% for a round-trip, excluding step-down and step-up transformer losses.
- The battery system has four loss categories: 1) Battery, 2) Power electronics, 3) Thermal management of batteries and enclosures, and 4) Control and monitoring.
- Electricity for site lighting, O&M, surveillance, etc.
Open URL and click on “View Open Manuscript”
See figures 3, 4 and 17 of article.
https://www.sciencedirect.com/science/article/pii/S0306261917315696
Source 2, based on EIA survey data from OPERATING grid-scale battery systems
Per EIA survey, grid-scale battery system losses (various technologies) are about 20%, AC-to-AC basis, excluding step-down and step-up transformer losses.
Aging had only a minor effect, because the battery systems were only a few years old.
https://www.eia.gov/todayinenergy/detail.php?id=46756
Sequence of Losses:
1) AC electricity from distribution, or high-voltage grid, via step-down transformer to battery voltage, loss about 1%
2) Through front-end power electronics to DC
3) Charge added to battery
4) Discharge from battery
5) Through back-end power electronics to DC, which is digitized to a sine wave, with same phase and 60-cycle frequency as the grid
6) AC electricity to distribution, or HV grid, via step-up transformer, loss about a 1%
Round-trip loss about 22%, greater with battery system aging. See URL
https://www.explainthatstuff.com/how-inverters-work.html
Source 3, based on the measured battery charge and discharge in South Australia
Losses were 100 x (1- 318, discharge/397, charge) = 100 x (1 – 0.801) = 19.9%; likely includes thermal management and aging, excludes step-down and step-up transformer losses.
https://opennem.org.au/energy/sa1/?range=all&interval=1M
Source 4, Hornsdale Battery System in Australia, supplied by Tesla
The image in the URL shows the efficiency (yellow line) decreasing from about 82% (a loss of 18%; similar to above Part 2) from Nov 2017 to about 75% (a loss of 25%) in April 2023, likely due to 5.5 years of aging.
The rapid aging may be due to the battery system being discharged and charged almost every day to maximize arbitrage revenues.
Source 5
Tesla mentioned a 10.5% round-trip loss of a single 4-h Megapack unit in its sales literature.
Net Energy delivered at 25°C (77°F) ambient temperature, including thermal control of batteries and enclosures. The 10.5% excludes:
1) AC from the grid via a step-down transformer; 1% loss, 2) AC to the grid via a step-up transformer; 1% loss, 3) Control and monitoring, 4) site lighting, 5) O&M, surveillance
Total AC-to-AC loss is at least 15% for a single Megapack system, not including aging. See Note
https://www.tesla.com/powerpack
NOTE: In case of battery systems with many Megapacks, Tesla applies a “design factor of about 0.93”, of which one side effect would be to increase losses, as shown by Source 4
PART 4
EIA Turnkey Capital Cost Surveys of Grid-Scale Battery Systems
The Energy Information Agency, EIA, has collected turnkey capital costs and operating data of the US energy sector for many decades.
EIA 2017 Report includes systems in operation during all of 2015
The first EIA report regarding turnkey capital costs of various types of grid-scale battery systems, not just lithium-ion types, was issued in 2017.
EIA 2020 Report includes systems in operation during all of 2018
US average turnkey capital cost was $625/kWh, delivered as AC, in 2018
https://www.eia.gov/todayinenergy/detail.php?id=45596
EIA 2021 Report includes systems in operation during all of 2019
US average turnkey capital cost was $589/kWh, delivered as AC, in 2019. See page 17 of URL
https://www.eia.gov/analysis/studies/electricity/batterystorage/pdf
EIA 2022 Report includes systems in operation during all of 2020
Battery Storage in the United States: An Update on Market Trends.
https://www.eia.gov/analysis/studies/electricity/batterystorage/
In 2020, the turnkey capital cost/kW significantly decreased.
US average turnkey capital cost was $623/kWh, delivered as AC, in 2020
See URL and table.
The table combines the data of the six EIA reports
The battery discharge duration increased from 0.5 h in 2015 to 3.2 h in 2019, because they are increasingly used in combination with solar systems to absorb midday solar output bulges.
See table 3 and page 18 of EIA URL
https://www.eia.gov/analysis/studies/electricity/batterystorage/pdf...
Grid-scale battery systems operate 8,766 hours per year
https://www.windtaskforce.org/profiles/blogs/economics-of-utility-s...
Li-ion battery systems are the preferred technology by utilities for storing large quantities of electricity, primarily because of their lower turnkey capital cost per delivered kWh as AC.
These systems have become a major part of the storage mix during the past few years, which has resulted in major average price decreases since 2017
Almost all recent additions were li-ion, which have a lesser cost/kWh for large, grid-scale systems.
NOTE: Various financial services entities, such as Bloomberg and Lazard, issue self-serving reports that project much lower battery system costs/kWh, than the EIA. Those entities tend to underestimate battery costs to avoid chasing away their wealthy clients who are seeking tax shelters, which would adversely affect their financial services business. It would be prudent to ignore their reports.
.
| EIA Reports, all technologies | 2015 |
2016 |
2017 |
2018 |
2019 |
2020 |
Count |
10 |
21 |
22 |
26 |
37 |
54 |
All-in, Turnkey Cost, $1000 |
116056 |
363547 |
194304 |
262014 |
214383 |
351977 |
Total Power, MW |
127 |
219 |
122 |
202 |
142 |
488 |
Total Energy Delivery, MWh |
55 |
257 |
258 |
420 |
364 |
565 |
Average Energy Delivery, h |
0.5 |
1.5 |
1.8 |
2.4 |
3.2 |
1.7 |
Average Power, MW |
13 |
10 |
6 |
8 |
4 |
9 |
Average Energy Delivery, MWh |
6 |
12 |
12 |
16 |
10 |
10 |
Avg. Cost/installed kW |
913 |
1664 |
1587 |
1300 |
1511 |
722 |
Avg. Cost/delivered kWh |
2102 |
1417 |
755 |
625 |
589 |
623 |
.
PART 5
General Comments Regarding EV Battery Systems
Grid-scale battery systems are entirely different from the mass-produced battery packs in EVs which operate about 700 hours per year, are warranted to have a loss of no more than 30% of capacity, at end of year 8, in case of Tesla
The cost of a 60-kW replacement battery is about $15,000, or $250/kWh, plus about $2,000 for labor, etc.; 2022 pricing
The cost of EV battery systems may decrease, due to more mass production, but likely will increase, due to: 1) increased inflation rates, 2) increased interest rates, 3) supply chain disruptions, which delay projects and increase costs, 4) increased energy prices, such as of oil, gas, coal, electricity, etc., 5) increased materials prices, such as of tungsten, cobalt, lithium, copper, manganese, etc., 6) increased labor rates.
Who, of rational mind, would replace a battery, at a $17,000 total cost, in an 8-y-old car?
As the Mar 30, 2022 price of tungsten was $320,000/ metric ton, prices of EV battery packs are likely to increase, rather than decrease
https://price.metal.com/Tungsten-Cobalt-Antimony
The purchase price of Tesla EVs (AWD, long range, no extras) are Model 3 ($48,880) and Model Y ($52,130)
Includes destination fee, order fee, as off August 2023.
Excludes state sales taxes, dealer preparation and documentation, and federal tax credits.
Financing at 6.2%/y over 8 years would far exceed any annual fuel cost reduction
Insurance for a Model 3 would cost $1,759 in Vermont, $4,820 in Louisiana
https://www.tesla.com/model3/design#payment
https://www.tesla.com/modely/design#payment
https://www.myamortizationchart.com
https://www.nerdwallet.com/article/insurance/tesla-insurance
EVs cost much more to own and operate, and are less capable, and have less range, especially in colder climates, than equivalent gasoline vehicles.
Such price levels are out of reach of 80% of US households, i.e., the EV subsidies and EV charger subsidies, paid for by government benefit mostly upscale households.
https://www.windtaskforce.org/profiles/blogs/poor-economics-of-elec...
https://www.windtaskforce.org/profiles/blogs/electric-bus-systems-l...
NOTE:
China is the world’s biggest market for EVs with total sales of 1.3 million in 2020, more than 40% of global sales that year.
China is the dominant battery pack producer, including anodes and cathodes, which require energy and raw materials , such as lithium, nickel and cobalt, and rare earth metals.
https://moneyweek.com/investments/commodities/industrial-metals/604...
NOTE: Lithium carbonate price was $41,060/metric ton, or $41/kg, on Jan. 3, 2022, about 5 times higher than in Jan. 2021
https://www.mining.com/ev-battery-costs-set-to-rise-in-2022/
NOTE: Pricing means end-user cost, which, in case of:
1) EVs, it is the drive-away cost to a driver, i.e., not just the cost of the battery pack itself
If a driver replaces an EV battery pack, the drive-away replacement cost would be higher
2) Large systems, it is the all-in turnkey cost to a utility to put the system in service.
It is always important to compare A-to-Z pricing, apples to apples
Many journalists and lay people have almost no idea what that means.
PART 6
Financing and Operating and Maintenance Costs of Grid-Scale Battery Systems
Any project has costs for: 1) turnkey capital, 2) financing, 3) annual O&M costs, and 4) periodic renovations, the same as a house,
Some of the financing cost, O&M cost, etc., are listed below:
1) Financing costs, such as due to amortized loans or bonds, are assumed at about 6%/y for 15 years. This is a significant annual expense. This percentage likely would be greater in 2025 than at present, because increased inflation rates often require increased interest rates. See Note.
NOTE: Examples of recent interest rate increases:
House mortgage rates increased from about 2.8%/y in 2021 to 7.2%/y in 2023, and may increase in future years.
Bank loan rates for battery systems increased from about 3.5%/y in 2021 to about 6.5%/y in 2023.
https://themortgagereports.com/61853/30-year-mortgage-rates-chart
2) Owner’s return on investment of about 9%/y, which is a standard annual return utilities make on their investments.
This percentage may increase in future years, to offset inflationary effects.
3) Battery system round-trip loss of about 20%, which increases with aging, as measured from distribution grid or high-voltage grid, AC-to-AC.
4) All other battery system O&M cost, including security, insurance, etc.
5) Financial benefits and subsidies, such as cash grants; tax credits; accelerated depreciation; loan interest deductions; waiving of state and local taxes, fees and surcharges; waiving of local real estate taxes, etc.
The intent of subsidies is to shift about 50% of project annual cost
This enables an Owner to offer battery services at a much lesser cost
This makes the use of batteries look politically more palatable.
Any shifted costs are paid by ratepayers, taxpayers and added to government debts
No cost ever disappears, per Economics 101
General comments regarding grid-scale battery systems:
1) Useful service life at most 15 years, if operated within 20% full and 80% full, and in a temperature-controlled enclosure.
2) Aging at about 1.5%/y (the capacity loss would be about 20% in year 15)
3) May catch fire, i.e., high insurance costs.
https://www.windtaskforce.org/profiles/blogs/high-costs-of-wind-sol...
PART 7
Battery System Capacity Loss, due to Aging
The three main components of battery system aging, and their assumed values for this analysis, are:
1) Front-end power electronics, assumed at 0.2%/y
2) Battery, assumed at 1.1%/y, for 24/7/365 service
3) Back-end power electronics, assumed at 0.2%/y
System capacity loss factor is 0.998 x 0.989 x 0.998 = 0.985, or 1.5%/y
For analysis, we assume a 1000 kWh battery system, with a 15-y life.
The table shows the system capacity loss due to aging
Most of the original battery system would need to be replaced in year 15
As an alternative, the original battery system could be oversized by about 25 to 30% to cover aging as the years go by.
The 20% losses discussed under section 2 would increase with aging
Year |
Aged |
Aging factor |
Capacity loss |
Battery |
|||
Capacity |
|||
kWh |
kWh |
||
0 |
1000 |
0.985 |
|
1 |
985 |
0.985 |
15 |
2 |
970 |
0.985 |
30 |
3 |
956 |
0.985 |
44 |
4 |
942 |
0.985 |
58 |
5 |
927 |
0.985 |
73 |
6 |
914 |
0.985 |
86 |
7 |
900 |
0.985 |
100 |
8 |
886 |
0.985 |
114 |
9 |
873 |
0.985 |
127 |
10 |
860 |
0.985 |
140 |
11 |
847 |
0.985 |
153 |
12 |
835 |
0.985 |
165 |
13 |
822 |
0.985 |
178 |
14 |
810 |
0.985 |
190 |
15 |
798 |
0.985 |
202 |
PART 8
Grid-scale Battery System Owning and Operating Cost for Solar Bulge Control
Battery systems perform various functions during a day, including absorbing the heavily subsidized, expensive, midday solar bulge, and discharging about 81% of it during the peak hours of late-afternoon/early-evening; the other 19% are system losses.
The utility paid at least 10 c/kWh to the Owner, but that was reduced by about 50%, due to various financial tax shelter gimmicks, including the upfront 30% ITC. See Part 4
Owners want a return on investment of at least 10%/y, when bank loans and long-term Bonds are 6.5%/y.
The 3.5% is a minimum for the hassles of designing, building, erecting, and paperwork of a project
Assumptions for Analysis
Assume, in the morning, the batteries are charged at about 20% full, so they can absorb the bulge to about 80% full.
On days, with little or no bulge, the batteries are charged with low-cost, night-time electricity
- Bank loan 50%
- State governments want Owners to have at least a 50% investment
- Megapack li-ion systems, $575/kWh for 2023. See Part 1
- Capacity factor, 0.6
- Owner return, 10%/y for 15 years
- Amortize bank loan, 6.5%/y for 15 years
- Cost of government subsidies, 50% of total costs
- System loss, 19%, from HV AC to HV AC. See Parts 2 and 3
- System loss, based on from HV grid at 20 c/kWh, to HV grid at 8 c/kWh
- System aging, 1.5%/y is ignored. See Part 7
The 51.9 c/kWh is understated due to ignoring 1) system aging, 2) downtime of some parts of the system, 3) any grid extension/augmentation to connect the battery systems, 4) decommissioning in year 15, i.e., disassembly, reprocessing and storing at hazardous waste sites. Also, using a very high 0.6 capacity factor reduces c/kWh, but increases aging
All project costs, including subsidies, are paid by ratepayers, taxpayers, and added to government debts.
http://www.windtaskforce.org/profiles/blogs/cost-shifting-is-the-na...
NOTE: Owners of grid-scale battery systems have the real owning/operating numbers, which they do not make public, because they are “proprietary”
Capacity, 1.0 MW/4 MWh |
2023 pricing |
||
Megapack li-ion, $/kWh |
575 |
||
Capital cost, excludes aging, $ |
2300000 |
Energy rating, kWh |
4000 |
Subsidies |
50% |
Cycles/d |
365 |
Owner return, 10%/y for 15 y |
50% |
CF |
0.6 |
Amortize bank loan, 6.5%/y for 15 y |
50% |
Fr. HV grid kWh/y as AC |
1081481 |
Owner return, $/y |
148296 |
In battery, kWh/y as DC |
973333 |
Payment to bank, $/y |
120213 |
To HV grid, kWh/y as AC |
876000 |
Total payments, $/y |
268509 |
System loss, kWh/y |
205481 |
Other costs, O&M, insurance, etc., $/y |
40000 |
Total cost, $/y |
454725 |
System loss, $/y |
146216 |
||
Total costs, $/y |
454725 |
Cost, $/kWh of throughput |
0.519 |
Paid to Owner by: |
|||
Government, as subsidies, $/y |
227363 |
0.260 |
|
Utility ratepayers, etc., $/y |
227363 |
0.260 |
|
Total, $/y |
454725 |
0.519 |
|
Fr HV grid |
1081481 |
||
$/kWh |
0.2 |
||
$/y |
216296 |
||
To HV grid |
876000 |
||
$/kWh |
0.08 |
||
$/y |
70080 |
||
$/y, loss |
146216 |
.
PART 9
Battery Systems Losses due to Absorbing Midday Solar Bulges
Those losses are a major battery operating cost almost never mentioned by stakeholders.
Those losses certainly are not obvious to lay people, including most legislators
Assume a grid has many solar systems
Assume midday solar bulges need to be reduced to maintain grid stability during each day of the year. See Note.
Assume 45,625 kWh/y of solar bulge is taken from the grid and fed to batteries during each day of the year.
This solar electricity would experience about a 20% loss after passing through the battery system.
About 45625 x 0.8 = 36,500 kWh/y would be left over after passing through the battery system, AC-to-AC basis
This solar bulge electricity has a heavily subsidized, all-in cost of about 22 c/kWh, if part of a “net-metered program”. See URL
http://www.windtaskforce.org/profiles/blogs/cost-shifting-is-the-na...
The 36,500 kWh/y would be fed to the grid during peak hours of late-afternoon/early-evening, when wholesale prices would be about 8 c/kWh
The electricity loss would be about 45,625 - 36,500 = 9,125 kWh/y
The dollar loss would be about 45625 x 22 c/kWh - 36500 x 8 c/kWh = $10038 - $2920 = $7,118/y, or 7118/36500 = 19.5 c/kWh of annual throughput
The $7118/y, or 19.5 c/kWh, is just one of the annual costs of dealing with midday solar bulges.
A significant part of the annual costs for financing, owning and operating the battery system, should also be allocated to dealing with midday solar bulges. (See PART 5)
Those costs are definitely not charged to solar system Owners (the grid disturbers) or battery system Owners
A utility likely “takes care of them” by burying them in the next rate increase request to the VT PUC, i.e., that loss is shifted onto ratepayers, taxpayers, and government debts
NOTE: Absorbing midday solar bulges likely will be minimal in New England and other snowy/overcast regions, on days with snow and ice on the panels, and overcast days. On such days, the batteries would be charged at night, when wholesale prices would be about 3 to 4 c/kWh.
PART 10
General Comments
All of the above is well known by the engineers of larger utilities, who proudly own multiple grid-scale battery systems.
Those utilities have the detailed operating and cost data to perform refined analyses.
They share some of their data with the EIA, on an anonymous basis.
They do not publish their analyses on their websites, or in their reports, or in their press releases, because that would likely cause major blowback from a better-informed citizenry.
Utilities think it is best to keep things fuzzy, cozy, and happy, with lots of smiling employees, always there to serve you.
Big Bucks are at Stake in the Small State of Vermont
If the "big-bucks-stakes" are multi-$billion in a small, mostly rural state, just imagine what they would be in large, mostly industrial states.
VELCO, which owns the Vermont high voltage grid, wants $2.2 BILLION to upgrade its grid to be ready for EVs, HPs, and more wind and solar, as part of fighting 1) climate change and 2) global warming
GMP, a major Vermont utility, with about 78% of Vermont’s electricity market, owned by Canadian/French investors, likely wants a similar capital infusion for 1) extending/augmenting its distribution grids and 2) building out a state-wide system of EV chargers.
GMP gets its funding, via the VT-Public Utilities Commission, the VT-Department of Public Service, and the VT Legislature
APPENDIX 1
The supply chains to “take wind and solar to the next level to meet 2050-zero-carbon climate goals” do not exist.
The supply chains would be MUCH MORE EXPENSIVE, due to economic policies which gave us:1) increased inflation rates, 2) increased interest rates, 3) supply chain disruptions, which delay projects and increase costs, 4) increased energy prices, such as of oil, gas, coal, electricity, etc., 5) increased materials prices, such as of tungsten, cobalt, lithium, copper, manganese, etc., 6) increased labor rates.
https://www.windtaskforce.org/profiles/blogs/battery-system-capital...
All that will make it much more expensive to reduce CO2 to “save the world from climate change” (if that were actually possible).
For example, the cost of financing has increased, i.e., higher interest rates for bank loans, because the official consumer price index, CPI, is increasing at 8.5%/y (the unofficial CPI likely is about 12%/y), and the producer price index, PPI, is increasing at 11.5%/y
Owners typically put up 50% of the turnkey capital cost of a wind, solar, or battery project, the rest is financed.
Owners typically make 9%/y on their investment, when bank interest rates are low, say 3.5%/y.
Owners may want to make a higher %/y, when bank interest rates are high.
All this translates in Owners having to sell their wind solar electricity, and battery services at much higher prices, i.e., wind and solar suddenly are not competitive with existing domestic, low-cost, coal, natural gas, nuclear and hydro.
1) Solar electricity
http://www.windtaskforce.org/profiles/blogs/cost-shifting-is-the-na...
2) Grid-scale battery system services
https://www.windtaskforce.org/profiles/blogs/battery-system-capital...
3) EVs, and EV chargers, and EV charging
https://www.windtaskforce.org/profiles/blogs/poor-economics-of-elec...
https://www.windtaskforce.org/profiles/blogs/electric-bus-systems-l...
APPENDIX 2
EXCERPT from:
COST SHIFTING IS THE NAME OF THE GAME REGARDING WIND AND SOLAR
http://www.windtaskforce.org/profiles/blogs/cost-shifting-is-the-na...
Pro RE folks point to the “price paid to owner” as the cost of wind and solar, purposely ignoring the other cost categories. The all-in cost of wind and solar, c/kWh, includes:
1) Above-market-price paid to Owners
2) Subsidies paid to Owners
3) Owner return on invested capital at about 9%/y
4) Grid extension/augmentation
5) Grid support services
6) Future battery systems
Comments on table 1
- Vermont legacy Standard Offer solar systems had greater subsidies paid to owner, than newer systems
- Wind prices paid to owner did not have the drastic reductions as solar prices.
- Vermont utilities are paid about 3.5 c/kWh for various costs they incur regarding net-metered solar systems
- "Added to rate base" is the cost wind and solar are added to the utility rate base, used to set electric rates.
- “Total cost”, including subsidies to owner and grid support, is the cost at which wind/solar are added to the utility rate base
- “NE utility cost” is the annual average cost of purchased electricity, about 6 c/kWh, plus NE grid operator charges, about 1.6 c/kWh
for a total of 7.6 c/kWh.
- “Grid support costs” would increase with increased use of battery systems to counteract the variability and intermittency of increased build-outs of wind and solar systems. See URL
https://www.windtaskforce.org/profiles/blogs/fuel-and-co2-reduction...
NOTE: NE wholesale grid price averaged about 5 c/kWh, starting in 2009, due to low-cost CCGT and nuclear plants providing at least 65% of all electricity loaded onto the NE grid, in 2019.
https://www.iso-ne.com/about/key-stats/resource-mix/
https://nepool.com/uploads/NPC_20200305_Composite4.pdf
NOTE: There are Owning costs, and Operating and Maintenance costs, of the NE grid.
ISO-NE charges these costs to utilities at about 1.6 c/kWh. The ISO-NE charges include:
Regional network services, RNS, based on the utility peak demand occurring during a month
Forward capacity market, FCM, based on the utility peak demand occurring during a year.
Table 1/VT & NE sources |
Paid to |
Subsidy |
Grid |
GMP |
Added |
ISO-NE |
Total |
NE |
Times |
|
|
paid to |
support |
|
to rate |
RNS+ |
|
utility |
|
owner |
towner |
cost |
adder |
base |
FCM |
cost |
cost |
||
c/kWh |
c/kWh |
c/kWh |
c/kWh |
c/kWh |
c/kWh |
c/kWh |
c/kWh |
||
Solar, rooftop, net-metered, new |
17.4 |
5.2 |
2.1 |
3.5 |
20.9 |
1.6 |
29.8 |
7.6 |
3.92 |
Solar, rooftop, net-metered, legacy |
18.2 |
5.4 |
2.1 |
3.5 |
21.7 |
1.6 |
30.8 |
7.6 |
4.05 |
Solar, standard offer, combo |
11.0 |
6.74 |
2.1 |
11.0 |
1.6 |
21.44 |
7.6 |
2.82 |
|
Solar, standard offer, legacy |
21.7 |
10.5 |
2.1 |
21.7 |
1.6 |
35.9 |
7.6 |
4.72 |
|
Wind, ridge line, new |
8.5 |
3.9 |
2.4 |
8.5 |
1.6 |
16.4 |
7.6 |
2.15 |
|
Wind, offshore, new |
9.0 |
4.1 |
2.4 |
9.0 |
1.6 |
17.1 |
7.6 |
2.25 |
Sample calculations:
NE utility cost = 6, Purchased + 1.6, (RNS + FCM) = 7.6 c/kWh
Added to utility rate base = 17.4, net-metered, new + 3.5 = 20.9 c/kWh
Total cost = 17.4 + 5.2 + 2.1 + 3.5 + 1.6 = 29.8 c/kWh
Excludes costs for very expensive battery systems
Excludes costs for very expensive floating, offshore wind systems
Excludes cost for dealing with shortfalls during multi-day wind/solar lulls. See URL
https://www.windtaskforce.org/profiles/blogs/wind-and-solar-provide...
“Added to rate base” is for recent 20-y electricity supply contracts awarded by competitive bidding in NE.
“Added to rate base” would be much higher without subsidies and cost shifting.
Areas with better wind and solar conditions, and lower construction costs/MW have lower c/MWh, than NE
New England has average winds, has highest on-shore turnkey costs ($2,400/kW in 2020), has highest PPA c/kWh
See page 39 of URL
https://www.energy.gov/sites/default/files/2021-08/Land-Based%20Win...
Views: 2622
Comment
-
Comment by Willem Post on December 28, 2022 at 7:37am
-
Theoretical and Practical Capacity of a Battery Cell
Theoretical Capacity
The faraday, F, is a dimensionless unit of electric charge quantity carried by 1 mole, which is about 6.02 x 10^23 electric charge carriers, such as ions). The 6.02 x 10^23 is known as Avogadro's constant.
In the International System of Units (SI), the coulomb (C) is the preferred unit of electric charge quantity.
The theoretical capacity, Q, of a battery cell can be calculated by Faraday’s law:
Equation 1; Qtheoretical = (nF) / (3600 s/h x Mw), yields a value with these units Ah/g
n is the number of charge carriers/ion;
F is the Faraday constant;
Mw is the molecular weight of the active cathode material.
If LiFePO4 → FePO4 + 1Li+ + 1e-
Mw of LiFePO4 is 157.76 g/mol. See table
n = 1 Li+ = 1
F = 96 485.3329 is the quantity of electric charge (aka 1 coulomb) carried by 1 mole of electrons
Ampere = Coulomb/s
Ah = C/s x 3600 s
mAh = (C/s x 1/1000) x 3600 s
Q = (1 x 96485.3329/mol of charge carriers) / (3600 s/h x 157.7 g/mol) = 0.1699 Ah/g, or 169.9 mAh/g of Lithium
Practical Capacity
In reality, the practical capacity of a battery cell is different from the theoretical one.
If LiNi1/3Co1/3Mn1/3O2
Theoretical Q = 277.8 mAh/g, if Mw = 96.462 g/mol and n = 1. See table
https://www.webqc.org/molecular-weight-of-Li+NiCoMnO6.html
The practical Q can be calculated by the voltage-time curve from galvanostatic cycling testing
Q/30 is the rate at which charge is added to the cell.
Qpractical = (I x A x tcut off) / (3600 x Mw), yields a value with these units mAh/g
where:
I is the current density; A/m2
A is the area; m2
tcutoff is the time to reach the cut off potential (Vcutoff); seconds
Mw is the molecular weight of the active material used in the electrode.
The practical Q depends on the charging rate, and the voltage range
For test run 1, a current A1 is applied, at voltage V1, for a period of h1 hours, until Q is achieved
During test runs the cell temperatures are monitored
After multiple test runs, at Q/30, in the specified 2.5 - 4.3 voltage range, the practical Q of a Li-NMC battery cell averages 165 mAh/g of Lithium metal, which is much less than the theoretical Q of 227.8 mAh/g
The practical Q is less than the theoretical Q, because not all Li can be removed from the lattice of the host material below 4.3 V, the cutoff voltage. The rest of the Li could be removed above 4.3 V, but that likely would damage the cell.
Lithium has an atomic weight of 6.941 g/mol; one electron per lithium atom; 1 C per mole of electrons; one ampere is one coulomb per second.
The theoretical Q = 1 x 96485.3329 / (3600 s/h x 6.941) = 3.861 Ah/g of lithium, or
Ah x V/1000 = 3.861 Ah/g x 3.7 V /1000 = 0.014319 kWh/g, or 70 g Li/kWh for a 3.7 V nominal Li-NMC or Li-NCA battery
Ah x V/1000 = 3.861 Ah/g x 3.2 V /1000 = 0.012384 kWh/g, or 80.9 g Li/kWh for a 3.2 V nominal LiFePO4 battery.
These are inaccurate values, because the utilization of lithium in real battery can never be 100%.
The lithium content in a lithium-ion battery of an electric vehicle would need to be about 0.85 kg of Lithium carbonate (Li2CO3 /kWh, which would contain about 0.16 kg of Lithium metal/kWh.
https://m.greenway-battery.com/news/How-Much-Lithium-is-in-an-Elect...
For example, if an EV, such as a Tesla Model 3, had a 75-kWh battery, it would require 0.16 x 75 = 12 kg of battery grade lithium.
Battery-grade is at least 99.5% pure metal. Standard-processed lithium requires additional processing to become battery grade.
https://www.mckinsey.com/industries/metals-and-mining/our-insights/...
NOTE: IATA uses theoretical values of lithium in batteries for air shipment. The IATA basis is 0.3 g Li/Ah, or 3.333 Ah/g Li, which for a single cell at 3.7 V nominal, would be 81 g Li/kWh, slightly greater than the above 70 g Li/kWh.
Clearly the IATA calculation is a gross underestimate, as it is barely enough Li to satisfy the theoretical minimum, never mind the practical minimum.
http://batteryuniversity.com/learn/article/bu_704a_shipping_lithium...
The above values are summarized in the table
Cathode type
LiFePO4
Li-Ni/3Mn/3Co/3O2
Li
Li
6.941
6.941
6.941
Fe
55.845
P
30.974
O x 4
64
Ni
19.564
Co
19.644
Mn
18.313
O x 2
32
Molecular wgt; g/mol
157.760
96.462
6.941
Theoretical capacity
n
1
1
1
Faraday constant
96485.3329
96485.3329
96485.3329
Mol. wgt.; g/mol
157.760
96.462
6.941
s/h
3600
3600
3600
Q; Ah/g of Li metal
0.1699
0.2778
3.8613
Q; mAh/g of Li metal
169.9
277.8
3861.3
Practical capacity
Q; mAh/g of Li metal
165
-
-
Often, people are exposed to mantras, such as:
DO THIS AND THAT, BY SUCH AND SUCH DATE, OR THE WORLD WILL BE DOOMED
Let’s get real
The BEST thing for New Englanders is ENERGY EFFICIENCY and MUCH SMALLER STATE GOVERNMENTSHere is an example of a very expensive experiment:
Germany, population about 84 million, reduced its fossil fuel from 84% to 76% of total primary energy, after spending at least $500 billion on its ENERGIEWENDE for over 20 years. That is the official number. The real number is at least $700 billion.
Much of the $700 billion likely was borrowed, so the interest on it could be up to $25 billion per year, which is accounted for somewhere else, per government bookkeeping rules
$700 billion/84 million people = $8,333/per person per 20 years, or $400/person/y, or $1,600 per family of 4, per year, not counting interest on borrowed money.
Remember, a lot of this includes low-hanging fruits, such as changing light bulbs, insulating, sealing, more efficient vehicles and appliances.
It gets more difficult and more expensive to add each ADDITIONAL percent reduction!!!
By this time, the EARLY solar and wind systems are being REPLACED with new ones, etc.
Where do you landfill all THAT junk?
This dismal example was accomplished by a rich, technologically advanced country, which most European countries, and New England, and the rest of the world, could not afford to imitate
Germany ruined its countryside with 500 to 600 ft tall wind turbines and solar systems all over Germany (to socially and "equitably" spread the blight), and deforested millions of acres for generating electricity from burning trees.
Germany increased its household electricity rates by more than 250% over these 20+ years
Germany and Denmark, another wind maven, have the highest household electricity rates in Europe, about 30 EUROCENT/kWh
In Germany, and the rest of Europe, a major increase in household and commercial/industrial electricity rates is in process, due to:
1) increased inflation rates, 2) increased interest rates, 3) supply chain disruptions, 4) increased energy prices, such as oil, gas, coal, etc., and 5) increased materials prices, such as of Tungsten, Cobalt, Lithium, and Copper
For Germany, and the rest of Europe, fighting climate change will be at the bottom of the list, despite Brussels’ declarations to do this and that, by such and such date.
-
-
Full Cost of Energy, FCOE
The Coastal Virginia Offshore Wind system, owned by Dominion Energy, had a turnkey cost of about $57 million for 15 MW of wind turbines. The $57 million is for the wind turbines, and to bring the power ashore.
https://wattsupwiththat.com/2022/05/20/what-is-the-full-cost/
Here is a summary of some cost items that would be close to the full cost of energy, FCOE, of offshore wind:
1) The capital cost of onshore transmission upgrades is socialized, i.e., charged to ratepayers/taxpayers.
2) The increase in operating, maintenance, wear and tear, and fuel costs imposed on OTHER generating plants, usually CCGTS, to counteract the variable wind output, 24/7/365
3) The operation and maintenance costs of the offshore wind turbine system, which are at least 3 times the cost of a similar onshore wind system
4) The cost of standby/reserve generation, staffed, fueled, ready to operate, in case the wind is insufficient
5) The annual cost of federal and state grants, subsidies, accelerated depreciation, deductions of loan interest costs, etc.
6) The annual cost of the owner’s return on his investment, at about 9%/y on about 50% of the turnkey cost,
7) The annual cost of amortizing any bank loans at about 6%/y, on about 50% of the turnkey cost
In the real world, a lot of these costs are not separately identified and quantified, and much of the costs would be SHIFTED to ratepayers, taxpayers and government debts, which makes offshore wind LOOK a lot less costly per kWh, than in reality
There is a massive disinformation campaign, aided and abetted by Wall Street and the Media, to make wind and solar appear less costly than in reality, to spread a widespread delusion we can have wind, solar and batteries at less cost than traditional fossil fuels.
-
-
Art,
Aging of batteries is a complicated issue
Electric car batteries are used just a few hours a day, thus would not age much, about 1%/y, if driven on shorter trips, more aging with frequent range driving.
Battery replacements are at least $12000, so it is better to take good care of them at all times.
Utility batteries are used 24/7/365, thus would age at a faster rate, about 1.5%/y, than car batteries
At all times, it is best to stay within the range of 15% full to 80% full, for long life, and less aging
Staying within that range during winter is absolutely necessary, because cold weather stresses batteries, and reduces range. You have to baby your battery when it is cold.
-
Comment by Art Brigades on March 9, 2022 at 12:54pm
-
There you go again, Willem. Raining on the Unicorn Parade!
I recall visiting Maine Huts & Trails near Flagstaff. They boasted about being off grid. A big solar array greets visitors as they hike in. After dinner I asked the staffer for a tour. There’s a basement full of batteries and wires. Impressive. He said the panels and batteries are good for about 4 hours a day. The other 20 hours you hear the drone of the diesel generator.
Maine as Third World Country:
CMP Transmission Rate Skyrockets 19.6% Due to Wind Power
Click here to read how the Maine ratepayer has been sold down the river by the Angus King cabal.
Maine Center For Public Interest Reporting – Three Part Series: A CRITICAL LOOK AT MAINE’S WIND ACT
******** IF LINKS BELOW DON'T WORK, GOOGLE THEM*********
(excerpts) From Part 1 – On Maine’s Wind Law “Once the committee passed the wind energy bill on to the full House and Senate, lawmakers there didn’t even debate it. They passed it unanimously and with no discussion. House Majority Leader Hannah Pingree, a Democrat from North Haven, says legislators probably didn’t know how many turbines would be constructed in Maine if the law’s goals were met." . – Maine Center for Public Interest Reporting, August 2010 https://www.pinetreewatchdog.org/wind-power-bandwagon-hits-bumps-in-the-road-3/From Part 2 – On Wind and Oil Yet using wind energy doesn’t lower dependence on imported foreign oil. That’s because the majority of imported oil in Maine is used for heating and transportation. And switching our dependence from foreign oil to Maine-produced electricity isn’t likely to happen very soon, says Bartlett. “Right now, people can’t switch to electric cars and heating – if they did, we’d be in trouble.” So was one of the fundamental premises of the task force false, or at least misleading?" https://www.pinetreewatchdog.org/wind-swept-task-force-set-the-rules/From Part 3 – On Wind-Required New Transmission Lines Finally, the building of enormous, high-voltage transmission lines that the regional electricity system operator says are required to move substantial amounts of wind power to markets south of Maine was never even discussed by the task force – an omission that Mills said will come to haunt the state.“If you try to put 2,500 or 3,000 megawatts in northern or eastern Maine – oh, my god, try to build the transmission!” said Mills. “It’s not just the towers, it’s the lines – that’s when I begin to think that the goal is a little farfetched.” https://www.pinetreewatchdog.org/flaws-in-bill-like-skating-with-dull-skates/
Not yet a member?
Sign up today and lend your voice and presence to the steadily rising tide that will soon sweep the scourge of useless and wretched turbines from our beloved Maine countryside. For many of us, our little pieces of paradise have been hard won. Did the carpetbaggers think they could simply steal them from us?
We have the facts on our side. We have the truth on our side. All we need now is YOU.
“First they ignore you, then they laugh at you, then they fight you, then you win.”
-- Mahatma Gandhi
"It's not whether you get knocked down: it's whether you get up."
Vince Lombardi
Task Force membership is free. Please sign up today!
Hannah Pingree on the Maine expedited wind law
Hannah Pingree - Director of Maine's Office of Innovation and the Future
"Once the committee passed the wind energy bill on to the full House and Senate, lawmakers there didn’t even debate it. They passed it unanimously and with no discussion. House Majority Leader Hannah Pingree, a Democrat from North Haven, says legislators probably didn’t know how many turbines would be constructed in Maine."
https://pinetreewatch.org/wind-power-bandwagon-hits-bumps-in-the-road-3/
© 2026 Created by Webmaster.
Powered by
![]()
You need to be a member of Citizens' Task Force on Wind Power - Maine to add comments!
Join Citizens' Task Force on Wind Power - Maine