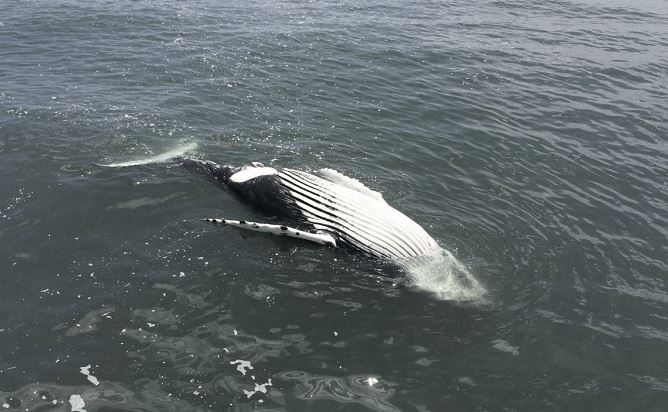
Floating humpback whale offshore of Delaware. Photo: Marine Education, Research & Rehabilitation Institute.
There have been a lot of dead whales on the East Coast of the US lately. David Wojik noticed that NOAA was investigating 178 dead whales in something called an Unusual Mortality Event, or a UME — it’s like an episode of X-Files.
.
NOAA says this wave of strandings mysteriously started in 2016 which was before the offshore wind factory industry got going — but Wojik points out the timing matches very well.
.
Offshore lease sales for the wind industry ramped up 2015-16. There were nine big sales, he says, off New Jersey, New York, Delaware and Massachusetts. And not so coincidentally, 2016 was also the year NOAA started giving permission slips for whale hunts, sorry whale harrassments for “geo-technical and site characterization surveys“.
.
In bureaucratic-valium-lingo, the license to cause incidental dead whales is called an IHA — or an Incidental Harassment Authorization. This appears to have fooled Greenpeace.
.
Although since wind turbines are a sacred totem, NOAA could have called them an 007 License to Kill Humpbacks and they might not have cared either.
.
The whales are dying "to save the planet" by means of offshore wind turbines.
They’re probably happy about it too, because they go the WHALE HEAVEN.
David Wojik, CFACT
.
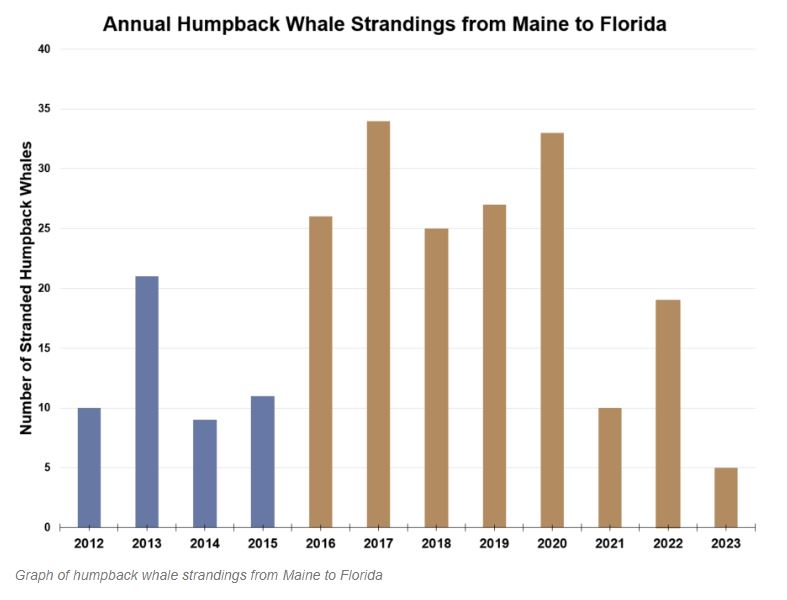
The “unusual mortality” data is astounding.
Basically, the humpback death rate roughly tripled starting in 2016 and continued high thereafter.
.
To date NOAA has issued an astounding 46 one-year IHA’s for offshore wind sites.
Site characterization typically includes the protracted use of what I call “machine gun sonar”, SONIC BOOMS.
.
This shipboard device emits an incredibly loud noise several times a second, often for hours at a time, as the ship slowly maps the sea floor.
Wojik explains, why wind “farms” might pose a threat to whales, and why it’s likely to get worse with bigger turbines and larger farms going in:
.
There are lots of ways this sonar blasting might cause whales to die.
Simply fleeing the incredible noise could cause ship strikes or fish gear entanglements, the two leading causes of whale deaths.
Or, the whales could be deafened, increasing their chances of being struck by a ship later on.
Direct bleeding injury, like getting their ears damaged, is another known risk, possibly leading to death from infection.
.
So there can be a big time difference between blasting and death.
.
NOTE: These deaths need not be in the immediate vicinity of the sonar blasting, so spatial correlation is unlikely. Humpbacks in particular are prodigious travelers. One group was tracked traveling 3,000 miles in just 28 days, over 100 miles a day on average.
.
Thus a sonar blasting/site characterization in one place, could easily lead to multiple whale deaths hundreds of miles away.
.
If one of these blasters suddenly goes off near a group of whales they might go off in different directions, then slowly die....
For more on this noise see my https://www.cfact.org/2022/07/26/threat-to-endangered-whales-gets-l...
.
The whole original article is at CFACT.
By the way, all of this, including rolling blackouts at ZUB-ZERO temperatures, and a lack of gas and oil for space heating, applies to New England, if:
1) New York State keeps obstructing new gas pipelines from Pennsylvania to New England; THIS SHOULD BE LEGALLY FORBIDDEN AS AN UNCONSTITUTIONAL INTERFERENCE OF INTER-STATE COMMERCE, and
2) The New England oil, gas and coal storage capacities near power plants are not increased by at least 100% to ensure RELIABLE ELECTRICAL SERVICE IN WINTER, WHICH WOULD BE ESPECIALLY IMPORTANT, IF UNCERTAIN, MOTHER-NATURE, WEATHER-DEPENDENT WIND AND SOLAR WERE FURTHER EXPANDED, AS THE US AIMS TO BLINDLY COPY THAT DISASTROUS EUROPEAN SCENARIO
.
ISO-NE REPORT OF 2021 ECONOMIC STUDY: FUTURE GRID RELIABILITY STUDY PHASE 1
https://www.iso-ne.com/static-assets/documents/2022/07/2021_economi...
DEEP DIVE SUMMARY OF THE ISO-NE REPORT
https://www.utilitydive.com/news/new-england-future-grid-study-iso/...
LIFE WITHOUT OIL
Life without oil means many products that are made with oil, such as the hundreds listed below, would need to be provided by wind and solar and hydro.
Folks, including Biden's attendants, wanting to get rid of fossil fuels, such as crude oil, better start doing some rethinking.
The above also applies to natural gas, which is much preferred by many industries
If you do not have abundant low-cost energy, you cannot have modern industrial economies.

APPENDIX 1
These articles contain significant information regarding wind, solar and grid-scale battery systems
GRID-SCALE BATTERY SYSTEMS IN NEW ENGLAND TO COUNTERACT SHORTFALL OF ONE-DAY WIND/SOLAR LULL
https://www.windtaskforce.org/profiles/blogs/grid-scale-battery-sys...
COLD WEATHER OPERATION IN NEW ENGLAND DECEMBER 24, 2017 TO JANUARY 8, 2018
https://www.windtaskforce.org/profiles/blogs/cold-weather-operation...
ANALYSIS OF WIND AND SOLAR ENERGY LULLS AND ENERGY STORAGE IN GERMANY
https://www.windtaskforce.org/profiles/blogs/wind-and-solar-energy-...
IRELAND FUEL AND CO2 REDUCTIONS DUE TO WIND ENERGY LESS THAN CLAIMED
https://www.windtaskforce.org/profiles/blogs/fuel-and-co2-reduction...
BATTERY SYSTEM CAPITAL COSTS, OPERATING COSTS, ENERGY LOSSES, AND AGING
https://www.windtaskforce.org/profiles/blogs/battery-system-capital...
HIGH COSTS OF WIND, SOLAR, AND BATTERY SYSTEMS IN US NORTHEAST
https://www.windtaskforce.org/profiles/blogs/high-costs-of-wind-sol...
CO2 is a Life Gas; No CO2 = No Life
https://www.windtaskforce.org/profiles/blogs/co2-is-a-life-gas-no-c...
APPENDIX 2
These articles explain a lot about the world-wide “Climate Crisis” scam, based on highly compromised surface station measurements, which typically read HIGH.
Climate scientists SUBJECTIVELY adjust the readings for use in their SUBJECTIVE computerized-temperature-calculation programs, which are used in the reports of IPCC, etc., for scare-mongering purposes.
New Surface Stations Report Released – It’s ‘worse than we thought’
https://www.windtaskforce.org/profiles/blogs/new-surface-stations-r...
Weather- Just how does it happen?
https://www.windtaskforce.org/profiles/blogs/weather-just-how-does-...
A summary of the results of three “Physics of the Earth’s Atmosphere” papers, which were submitted for peer review at the Open Peer Review Journal.
https://globalwarmingsolved.com/2013/11/19/summary-the-physics-of-t...
APPENDIX 3
Satellites and balloons measure temperatures of the Troposphere, which starts at ground level, and has an average height of 59,000 ft at the tropics, 56,000 ft at the middle latitudes, and 20,000 ft at the poles. Above those levels starts the Stratosphere.
Balloons directly measure temperatures. Satellites measure radiation, from which temperatures are calculated.
Both consistently measure much lower temperatures than the average of 102 computer-generated graphs.
See Appendix 2 and 3
The data in the below images is for a 43-y period.
There is global warming, but it is not anywhere near as much as scare-mongers are claiming.
https://www.windtaskforce.org/profiles/blogs/grid-scale-battery-sys...
1) Objective satellite and balloon temperatures increased from 0.00 to 0.5 C, or, or 0.116 C/decade
2) Subjective computer-generated temperatures increased from 0.00 to 1.20 C; or 0.28 C/decade, about 2.7 TIMES AS FAST
The temperature data by satellites and balloons are more accurate than land-based measurements.
See Appendix 2 and URL
https://en.wikipedia.org/wiki/UAH_satellite_temperature_dataset
Satellite measurements are made many times during every day and systematically cover almost the entire world; +/- 85-degree latitude.
The satellite data is vastly more complete, and accurate than would be gathered by ground stations. (See Appendix 2)
Balloon measurements, made on a sampling basis, are vastly less complete than satellite measurements, but they serve as a useful crosscheck on the satellite measurements.
NOTE: Behind the 102 computer graphs are hundreds of organizations that likely receive a significant part of their revenues from governments and subsidy-receiving wind, solar, battery, etc., businesses.
The livelihood and career prospects of the people creating these graphs is more secure, if they aim high, rather than low.
https://www.scienceunderattack.com/blog/2021/2/22/latest-computer-c...
NOTE: The bottom dotted, squiggly graph is the Russian Model (IMM-C-M4), which is close to the balloon and satellite data.

A more detailed view of satellite temperatures.

APPENDIX 4
Science and Environmental Policy Project (SEPP) and also a member of the CO2 Coalition. Sheahen and the Coalition are collaborating on a brief.
SEPP’s October 8 newsletter contains a summary of a major 2021 paper by Happer and co-author William van Wijngaarden that completely undermines the fake “science” the IPCC and EPA used to support the case of climate alarm.
Sheahen specifically discusses the efforts of Professors William van Wijngaarden and William Happer in their pioneering work in calculating the real-world Global Warming Potentials (GWPs) of the five most common Green-House Gases (GHGs).
Sheahan explains why the approach used by IPCC is faulty, but nonetheless used by its followers, such as the US National Center for Atmospheric Research (NCAR) and the EPA.
These faulty methods lead to great exaggeration of the greenhouse effect of carbon dioxide, methane, and other minor greenhouse gases. . . .
Sheahan shows the stunning agreement between the calculations of van Wijngaarden and Happer (W & H) with satellite measurements (and balloon measurements) of outgoing infrared radiation emitted by the earth to space . . .
Sheahan claims, because of the exceptionally good agreement between observational data and the calculations of W & H, we can conclude the W&H model has been validated.
The W&H model embodies the scientific method.
In that case, it is reasonable to use it to study other hypothetical cases.
It is not possible to do so with IPCC models, which have never achieved agreement with observations. . .
See Appendix 3
The gist of the H&W work is the greenhouse effect of CO2 in the atmosphere is almost entirely saturated, such that any additional CO2 can have almost no additional warming effect.
Here is a chart prepared by Sheahan to illustrate the H&W results.
As atmospheric CO2 increases, say from 380 to 420 ppm, it has less warming effect.
The most warming effect occurs at very low levels of CO2, say 20 to 60 ppm.
https://climatechangedispatch.com/in-search-of-a-near-perfect-co2-g...
.
 .
.
APPENDIX 5
A timely and important new paper has just been uploaded to the CO2 Coalition website on nitrogen.
The first half of the paper on the greenhouse warming effect of N2O is quite technical
It is summarized in the first link.
Link to the full paper is at the bottom. Please distribute widely.
Authors: Will Happer, C. A. de Lange, William Wijngaarden and J.D. Ferguson
Nitrous Oxide and Climate – Why restricting N2O emissions is unnece...
Nitrous oxide (N20) has now joined carbon dioxide (CO2) and methane (CH4) in the pantheon of “human-generated demon” gases.
GW scare-mongers view increasing concentrations of these molecules are leading to unusual and unprecedented GW, which will lead to catastrophic consequences for both our ecosystems and humanity.
Countries around the world are in the process of greatly reducing, or eliminating, the use of nitrogen fertilizers, based on heretofore poorly understood properties of nitrous oxide.
Reductions of N2O emissions of 40 to 45 percent are being proposed in Canada , and by up to 50 percent in the Netherlands .
Sri Lanka’s complete ban on fertilizer in 2021 led to the total collapse of their primarily agricultural economy.
The CO2 Coalition has published this paper, which evaluates the GW effect of the N20 and its role in the nitrogen cycle.
Policymakers can now proceed to make informed decisions about the costs and benefits of mandated N20 reductions of this beneficial molecule.
This new paper joins previous CO2 Coalition reports on other greenhouse gases, carbon dioxide and methane.
Key takeaways from the paper:
- At current rates, a doubling of N2O would occur in more than 400 years.
- Atmospheric warming by N2O is estimated to be 0.064 C per century.
- Increasing crop production requires continued application of synthetic nitrogen fertilizer to feed a growing population.
Download the entire PDF Nitrous Oxide
It is dangerous to be correct in matters, where established men are wrong, by Voltaire

You need to be a member of Citizens' Task Force on Wind Power - Maine to add comments!
Join Citizens' Task Force on Wind Power - Maine