CO2 IS A LIFE GAS; NO CO2 = NO FLORA AND FAUNA
https://www.windtaskforce.org/profiles/blogs/co2-is-a-life-gas-no-c...
Despite achieving nothing but a holiday junket for 45,000 people, many of whom arrived in over 500 private jets, COP27 has managed to eke out the usual PR “win” in the grand media theater.
They have a document they call a historic breakthrough, which is actually nothing but a wish list for future UN wet dreams and enlargement.
It’s just a “roadmap for future decision-making” meaning, they haven’t made any decisions yet.
They can’t say who’ll pay, or who’ll get the money, or how big the money will be, or exactly what it will be used for.
But they can say they will meet again and again, to figure it out.
The UN simply announced a new category of globalist grafting.
International efforts to reduce CO2 emissions are more than negated, because the CO2 of growing global energy consumption is much greater than the CO2 reduction of new renewable energy systems
“…the text of the agreement leaves open a number of crucial details to be worked out next year and beyond, including who would contribute to the fund and who would benefit.”
There is no agreement over what should count as “loss and damage” caused by climate change – which could include damaged infrastructure and property, as well as harder-to-value natural ecosystems or cultural assets.
A report by 55 vulnerable countries estimated their combined climate-linked losses over the last two decades totaled $525 billion, or 20% of their collective GDP.
Some research suggests that by 2030 such losses could reach $580 billion per year.
The mantra “Loss and damage” is merely a plan to tax the West for bad weather in Somalia, or a frost in Uruguay
If "loss and damage" would ever amount to anything, nations of the West would just shift money from “foreign aid” to “loss and damage” baskets, and funnel the funds through the inefficient UN, which has proven to be an ineffective way to help the world’s poor.
It will fatten up corruptocrats in Third-World countries.
It will provide bread and honey for UN junketeers.
There will be no incentive for the tin-pot nations to build sea-walls, stop erosion, or do hazard reduction to stop fires — because the greater their "loss and damage", the greater their loss claims, and the greater their compensation.
Third-World governments will be less accountable for their own incompetence, as they shift blame to the West, but they’ll get more dependent on the UN as their go-to "sugar-daddy".
All in all, it will be a win for creeping communism, but a loss for the everyone else.
It’s another road to the World Economic Forum, WEF, mantra: "One World Order and One World Government"
.
Human Body is Made for Warm Weather
.
Humans evolved in warm environments. The body is better equipped to handle heat than cold, as it can regulate temperature through sweating and other mechanisms.
However, in cold weather, our bodies must work harder to maintain a normal temperature, which can lead to a variety of health problems.
Anecdotes of heart attacks induced by shoveling snow are common in northern climes. When exposed to cold temperatures, the body’s blood vessels constrict to conserve heat, which can increase blood pressure and strain the heart.
The relative dryness of cold air is irritating to airways, causing inflammation and making breathing more difficult, particularly for those with preexisting respiratory conditions like asthma or chronic obstructive pulmonary disease (COPD).
Civilizations flourished when temperatures were higher, especially when home heating was primitive or nonexistent.
Some of the earliest civilizations – such as those in Mesopotamia, Egypt, and the Indus Valley – developed in warm, arid regions, with fertile soils and abundant water resources. They were able to support large populations that developed sophisticated technologies, such as irrigation systems that made agriculture possible in dry lands.
Warmer temperatures are associated with higher crop yields, particularly for plants like wheat, rice and maize. Greater warmth increases the length of the growing season and improves the rate of photosynthesis.
https://wattsupwiththat.com/2023/04/09/history-and-human-biology-ar...
.
WHAT DID THE WORLD LOOK LIKE IN THE LAST ICE AGE?
https://www.windtaskforce.org/profiles/blogs/what-did-the-world-loo...
EXCERPT:
Was it all endless glaciers and frozen ice?
The answer is a partial yes—with some interesting caveats.
The Last Glacial Maximum (LGM), colloquially called the last ice age, was a period in Earth’s history that occurred roughly 26,000 to 19,000 years ago.
This map by cartographer Perrin Remonté offers a snapshot of the Earth from that time, using data of past sea levels and glaciers from research published in 2009, 2014, and 2021, alongside modern-day topographical data.
.
LIA, RWP, and MWP
The earth had a Little Ice Age, LIA, with many years of very cold temperatures, poor crops, famine, population stagnant, due to diseases and lack of food
The rivers Rhine, Thames, and Seine freezing up, and people going with horse and carriage on the ice, and having festivals on the ice, as recorded on paintings in European museums
All that time, from the year zero of the Christian Era to about 1900, the CO2 was about 280 ppm, near the lowest level in its 4.5 billion existence!
.
.
Just before the LIA, had been the Medieval Warm Period, and the Roman Warm Period, during both of them it was much warmer than to-day, BUT CO2 HAD NOT CHANGED.
All subjective computer models cannot replicate that, i.e., work backwards, because they are political and based on the objective inputs, to reinforce the gloom-and-doom temperature lies to the naive, gullible public.
If CO2 played no role during those times, why would it be accused of playing a role now?
.
When the Ice Returns it is Time to Adapt and/or Migrate
The CO2 ppm in the atmosphere is just above starvation levels of flora and fauna; the lowest in 600 million years. It is one of the reasons so many world areas have desert conditions.
The red dot shows the CO2 added by humans
Do you see the scare-mongering hockey stick?
We need more CO2 ppm, not less
The imposition of environmental, social, and corporate governance (ESG), on businesses has proved an economic/financial disaster
Net-Zero by 2050 to reduce CO2, already near minimum levels, is a suicide pact
CO2 has minimal GW impact
At every location on Earth, the number of molecules of CO2/m3 varies with dilution by water vapor and temperature.
Where water vapor and temperature are higher than at the Poles, the number of molecules of CO2/m3 is always fewer.
The maximum temperature increase by CO2 is 0.0060 C at Taoudenni, Mali.
This increase is over a range of CO2 of 311 to 418 molecules per kg of dry air
https://setpublisher.com/index.php/jbas/article/view/2456/2228
.
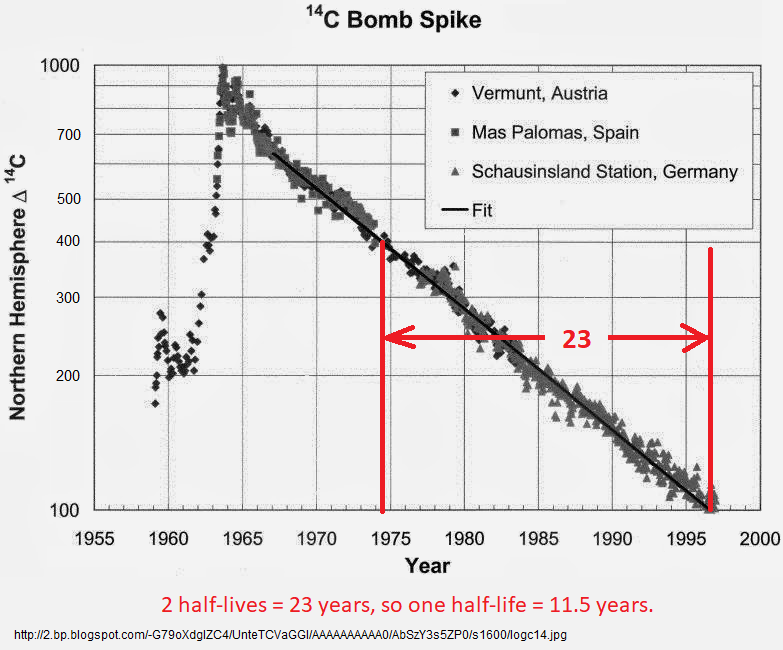
CO2 Half Life and Residence time; by David Burton
.
The residence time is precisely determined from the decay rate of the 14C "bomb spike" after the atmospheric test ban treaty. This is a log scale plot of the decline of 14C levels in the atmosphere:
https://sealevel.info/logc14_two_half-lives.png
.
.
When atmospheric tests of A-bombs and H-bombs suddenly ceased (because of the atmospheric test ban treaty), the 14C concentration dropped on a near-perfect exponential decay curve, with a half-life of 11.5 years, implying a residence time of 16.6 years. (Note: ¹⁴CO2 is 4.5% heavier than normal ¹²CO2, which affects biological uptake and diffusion rates slightly. But not much.)
About 99% of all carbon found on Earth is 12C. About 1% of all carbon on Earth is 13C isotopic, 14C is still much rarer. Only one of every trillion carbon atoms is 14C; it is radioactive and slowly decays to 12C
.
"Residence time" and "Effective Residence time"
The "residence time" is implied by the percentage of isotopically identifiable carbon remaining in the atmosphere, some period after a perturbation of its level. But it is much shorter than the "effective residence time" or "adjustment time," for a change in the total amount of carbon in the atmosphere.
The reason is, some of the processes which remove ¹⁴CO2 from the atmosphere do so by exchanging it, one-for-one, for ¹²CO2. Those processes cause the fraction of "fossil carbon" in the atmosphere to decline without actually reducing the amount of CO2 in the atmosphere.
That means the 11.5 year half-life and 16.6 year residence time are necessarily less than the effective lifetime of CO2 emissions.
The effective lifetime of anthropogenic additions to CO2 in the atmosphere, defined as the time it would take for (1 - (1/e)) = 63% (sometimes rounded to 2/3) is roughly fifty years, making the half-life about 35 years.
That's the result Prof. Richard Lindzen reported during the Q&A (3rd video) of this (excellent!!!) lecture:
● Part 1:
https://www.youtube.com/watch?v=hRAzbfqydoY
● Part 2:
https://www.youtube.com/watch?v=V-vIhTNqKCw
● The Q&A which followed (3rd video):
https://www.youtube.com/watch?v=69kmPGDh1Gs (including his discussion of CO2 atmospheric lifetime)
That's also the approximate result that Dr. Roy Spencer found:
http://www.drroyspencer.com/2019/04/a-simple-model-of-the-atmospher...
That's also the approximate result which I got, first with a little program to simulate declining CO2 levels, based on the historical CO2 removal rate as a function of CO2 level, and then with a modified version of the program based on Dr. Spencer's model. The source code is here:
https://sealevel.info/CO2_Residence_Times/
Ferdinand Engelbeen reported roughly the same result, here:
https://edberry.com/blog/climate-physics/agw-hypothesis/contradicti...
Almost all of CO2 ppm Increase since 1850 is from Mankind
We have solid data which proves beyond legitimate dispute that mankind can claim credit for almost all of the 105 ppm increase in atmospheric CO2 concentration since precise atmospheric CO2 concentration measurements began in 1958:
https://sealevel.info/carbon/carbonflux.html
The mistake which the climate alarmists make is, they claim the increase in atmospheric CO2 is harmful, or even a "crisis" or "emergency."
Actually, the scientific evidence is compelling that man-made climate change is modest and benign, and CO2 emissions are beneficial, rather than harmful.
Scientists call the periods of warmest climate "climate optimums," including periods like the Eemian climate optimum, which is believed to have been several degrees warmer than now.
The supposed major harms are all merely hypothetical (& mostly implausible). None of them are actually happening:
* Sea-level rise has not significantly accelerated.
* Storms have not worsened.
* Droughts have not worsened, and drought impacts have been significantly mitigated by higher CO2 levels.
* Floods have not detectably worsened.
* Fires have not worsened.
* The corals are fine.
The benefits of rising CO2 levels are real, measured & very large: improving crop yields, and a greening planet.
The benefits of CO2 for agriculture have been settled science for over a century. Note the date on this article!
Gradenwitz A. ; Carbonic Acid Gas to Fertilize the Air. Scientific American, November 27, 1920.
doi:10.1038/scientificamerican11271920-549
https://sealevel.info/ScientificAmerican_1920-11-27_CO2_fertilizati...
This NASA video is about how CO2 is greening the Earth:
https://www.youtube.com/watch?v=zOwHT8yS1XI
You can learn more, and find documentation for the facts I've mentioned, here:
https://sealevel.info/learnmore.html
.
Solar Radiation of the Earth
http://assets.press.princeton.edu/chapters/s9636.pdf
https://www.atmos.washington.edu/~dennis/321/321_Lecture_5.pdf
https://www.e-education.psu.edu/earth103/node/1004
Simplified schematic of the global carbon cycle (IPCC, 2013)
Numbers represent carbon stocks in Pg C and annual carbon exchange fluxes in Pg C yr-1. Black numbers and arrows indicate carbon stocks and exchange fluxes estimated for the time prior to the Industrial Era. Red arrows and numbers indicate annual "anthropogenic" fluxes averaged over the 2000-2009 time period..
.
.
The below image shows various carbon flows (Pg/y, in red) and carbon storages (Pg, in blue)
1 Pg = 10^15 gram = 1 billion metric ton
1 Metric ton = 10^6 gram
Storages
Atmosphere 750 Pg; is increasing by about 2 – 3 ppm/y, due to various inflows and outflows
Ocean, near surface 725 Pg
Ocean, intermediate and deep ocean 37,275 Pg
Plants 560 Pg
Soils 500 Pg
Earth crust 10^8 Pg
Fossil fuels, remaining 5,000 to 10,000 Pg; in 2023, the world obtained 8.3 Pg of coal/y, which is about 70% carbon, and 5.1 Pg of oil, which is about 85% carbon, and 2.8 Pg of gas, which is about 75% carbon
.
Henry’s Law of Partial Pressures
Henry's Law is one of the gas laws. It was formulated by a British chemist, William Henry, in 1803. It states that the solubility of a gas in contact with a liquid surface, such as the ocean, is proportional to the partial pressure of the gas.
The practical consequence of Henry's Law is the maintenance of a constant ratio between the amount of CO2 in the oceans to that in the atmosphere for a given temperature. This ratio is about 50/1.
Therefore, the consumption of all the planet's reserves of coal, oil, and gas (5,000 to 10,000 Pg) will result in about 100 to 200 gigaton of C of the CO2 being added to the atmosphere, an increase of 13% to 26%, over a period of about 75 to 100 years. The remainder will be absorbed by the oceans.
http://watsongallery.ca/ClimateReality/CR/Presentations/2016.07.10....
Henry's Law is a fundamental law of physical chemistry which prohibits man’s increase of net atmospheric CO2 Therefore, man and his use of fossil fuels does not cause climate change.
.
.
Solar Radiation, Reflection and Absorption, per Princeton University
Solar SW radiation in space is 1366 W/m2, through a circle with area = PiR2
Surface area of sphere = 4PiR2
Average SW solar radiation, at the top of the atmosphere, is 1366/4 = 342 W/m2; about 400 at equator; about 200 at poles. See above image, green line
Reflection of SW radiation by clouds, earth surface, etc., does not change its frequency
Incoming SW solar radiation absorbed by atmosphere 67 W/m2 (warms atmosphere) and reflected off clouds as SW to space 77 W/m2
Incoming SW radiation reflected by earth surface as SW to space 30 W/m2
Incoming SW radiation absorbed by earth surface = 342 – 67 – 77 – 30 = 168 W/m2
Total incoming radiation from space = 342, SW - 77, SW - 30, SW = 235 W/m2
Outgoing LW radiation from earth surface 390 W/m2, of which absorbed by atmosphere 350 W/m2 (warms atmosphere) and to space 40 W/m2
LW radiation returned from atmosphere to earth surface 324 W/m2
Outgoing LW radiation from atmosphere to space 165 W/m2
Outgoing LW radiation from clouds to space 30 W/m2
Total outgoing radiation to space = 40, LW + 165, LW + 30, LW = 235 W/m2
Convection to atmosphere = Thermals, 20 + Evaporation/transpiration, 82, = 102 W/m2
Total radiation absorbed by earth surface, from sun as SW 168 + from atmosphere as LW 324 = 492 W/m2
Total radiation leaving earth surface = LW radiation 390 + T & E 102 = 492 W/m2
http://funnel.sfsu.edu/courses/metr104/f12/handouts/TQ_EarthsEnergy...
http://assets.press.princeton.edu/chapters/s9636.pdf
.
Earth’s Albedo
The American Meteorological Society 17) states: “On average, the earth reflects 31 units of solar radiation back to the space for every 100 units received (thus, the total earth albedo is 0.31). The cloud albedo accounts for 23 units of the 31”.
Earth albedo = 1 - Outgoing LW radiation/Incoming SW radiation = 1- 235/342 = 0.312
The cloud albedo accounts for 0.23 of the 0.312, per the American Meteorological Society
The 342 - 235 = 107 W/m2 is not lost. It is being circulated between the earth's surface and the atmosphere
World temperature, if the earth were a black body, with no atmosphere, would be -18 C, or 255 K. See Note
World measured average temperature = 13 C, or 288 K
The greenhouse effect is 288 - 255 = 33 K
NOTE:
A black body absorbs all radiation at all frequencies, reflects nothing. A black body emits radiation at all frequencies. The amount of radiation emitted at each wavelength depends only on the object's temperature and not on any other property of the object, such as its chemical composition, per Max Planck in 1900.
.
.
Solar radiation, at short wavelengths, heats the surface, which emits radiation at long wavelengths, because of its low temperature
The atmosphere is transparent to short wave, but not transparent to long wave radiation.
GHGs, such as CO2 and water vapor, absorb long wave radiation, but only at certain frequencies.
GHGs get warmer and re-radiate their heat (long waves) in all directions, including towards the surface.
As humankind puts CO2 and other greenhouse gases into the atmosphere, the emissivity of the atmosphere increases.
The atmosphere absorbs more and more long wave radiation emitted by the surface and reemits it in all directions, including downward, and consequently the surface temperature increases, causing more water vapor and clouds
The higher the atmosphere temperature, the more water vapor a given volume can hold.
Because, water vapor is a greenhouse gas, this increase leads to a bit more warming still, and so on. This process is known as positive feedback.
Green House Gases
CO2 was 1.66 W/m2 global warming radiative forcing @ 379 ppm, and 1.81 W/m2 @ 391 ppm
All GHGs were 2.64 and 2.83, respectively
CO2 is by far the greatest of GHGs.
Contribution to greenhouse effect is 14 to 25%.
See page 678 of URL
https://www.ipcc.ch/site/assets/uploads/2018/02/WG1AR5_Chapter08_FI...
Contribution to Greenhouse Effect
Water vapor, 39 to 62%
Clouds, 15 to 36%
Water vapor and clouds, 67 to 85%
CO2, 14 to 25%
All other GHGs, 5 to 9%
http://assets.press.princeton.edu/chapters/s9636.pdf
CO2 absorbs longwave radiation at 2.0 microns, 2.7 microns, 4.3 microns, and 14.9 microns. Most of the long wave radiation is not absorbed by CO2.
About 8% of the available radiation is picked up by these "fingerprint" frequencies of CO2.
A CO2 molecule is a pigmy compared to water vapor molecule (H2O) regarding global warming.
Water vapor absorbs long wave radiation at many frequencies.
See dark areas in image.
.
.
Cloud Cover
.
The average albedo of clouds is 0.5, but can be 0.9 for thick clouds
The average albedo of the surface is 0.1, but much greater, if covered with fresh snow and ice
The best estimate, at present, is that the average flow of shortwave energy reflected by clouds back to space is about 50 W/m2 (loss), while the longwave warming effect of clouds amounts to about 30 W/m2 (gain). So, at the moment, the net effect of clouds is to cool the planet by about 20 W/m2.
https://geography.name/cloud-cover-precipitation-and-global-warming/
Water Vapor
Water vapor is responsible for about 50% of the 33C greenhouse effect. If there were no GHGs, including water vapor, the planet would not be a comfortable 15C, but at a very uncomfortable -18C
https://climate.nasa.gov/ask-nasa-climate/3143/steamy-relationships...
Increased CO2 is a Boon for Biomass Growth Worth Many $Billions
The CO2 radiative driving force, with 412 ppm is about 2.0 W/m2. It varies up and down very little.
The radiative driving force is about 120 W/m2 for clouds and water vapor. It varies up and down very much.
CO2 is just a tiny actor regarding global warming.
Even, if CO2 ppm were to double, which would use up all fossil fuel, the additional driving force would be minimal, as shown in below graph at the bottom of Appendix 4
CO2 has increased crop yields, and plant growth and helped feed the world
It has thickened the forests, increased mangroves, and reduced desertification (Goklany, 2015)
There are 18 million more square kilometers of greenery in the world (Zaichun, 2016).
If temperatures increase two degrees, and CO2 hits 700 ppm, corn is estimated to grow 25% faster and soy beans will boom by 31%. (Qiao et al 2019)
Let’s burn coal, oil and gas and feed the world.
See Images
The more CO2 in greenhouses and the environment, the more biomass growth
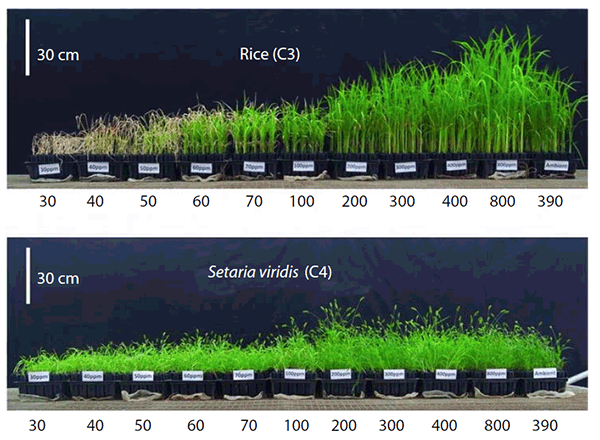
Carbon dioxide fertilization (in ppm, horizontal axes) of C3 crop and C4 weed
Source: von Caemmerer, et al. (2012).
.
About 90% of 700 Pacific and Indian ocean are growing more than shrinking (Duvat..., and the 11% that are shrinking are too small to have human inhabitants.
Third World folks are happy with cars, trucks, electricity, antibiotics, gas and planes.
They like the West’s fertilizer, polyester-cotton, concrete, sealed roads and smart phones.
The game of retrospective “loss and damage” can be played by both sides.
“There is no need to pay reparations.
Our leadership of the industrial revolution brought prosperity to the world and led to increased life expectancy and better living conditions.”
As CO2 increased, the population of Africa expanded from 155 million one hundred years ago, to 1,500 million now. A billion more African lives…
UN IPCC Climate Gate
The graph shows no decrease in CO2 during the 400-y Little Ice Age, LIA, from 1450 to 1850; the low temperature point was about 1700!!
Some years ago, the UN IPCC claimed, the LIA was merely a European climate event, because the more than 100 computer programs could not explain why CO2 in the atmosphere did not decrease with temperature during the LIA.
The UN IPCC would never admit the more than 100 computerized temperature predictions were “running hot”
However, scientists from various parts of the world claimed their countries had an LIA as well.
A red-faced IPCC had to stop making its spurious claim. See image
The LIA event is just one more proof, CO2 had nothing to do with the world’s temperature for at least 400 years.
Those laws of physics have not changed!!
Comments on APPENDIX 4
Whereas, the CO2 ppm increased from about 280 ppm in 1825 to 412 ppm in 2020, the increase in temperature due to that ppm increase was less than 0.1 C, as shown by the graph in Appendix 4.
The Appendix 4 graph shows, each 20-ppm increase of CO2 beyond 412 ppm, causes less and less of an increase in temperature!!
Any additional temperature increase, during that period, likely was due to other factors, such as reduced cloud cover
https://wattsupwiththat.com/2022/11/23/co2-is-innocent-but-clouds-a...
The UN IPCC found it so convenient to blame evil, poisonous CO2, but, finally, that game is over.
Comments on APPENDIX 5
The same holds true for methane, CH4, aka natural gas, and N20, nitrous oxide
Both are used for producing fertilizers.
The world’s population could not be fed without them
For example: Some scare-mongered politicians in Sri Lanka banned fertilizers to create the appearance of being “green”, but nationwide crop failures were the result!!
REFERENCES
Duvat, V. K. E. (2018). A global assessment of atoll island planform changes over the past .... Wiley Interdisciplinary Reviews: Climate Change, e557. doi:10.1002/wcc.557
Goklany, Indur (2015) Carbon Dioxide, The Good News, GWPF
Qiao, Y et al (2019) Elevated CO2 and temperature increase grain oil concentration but their impacts on grain yield differ between soybean and maize grown in a temperate region, Science of The Total Environment,Volume 666, 20 May 2019, Pages 405-413
Zaichun Zhu, et al (2016) Greening of the Earth and its drivers, Nature Climate Change, Letter, doi:10.1038/nclimate3004
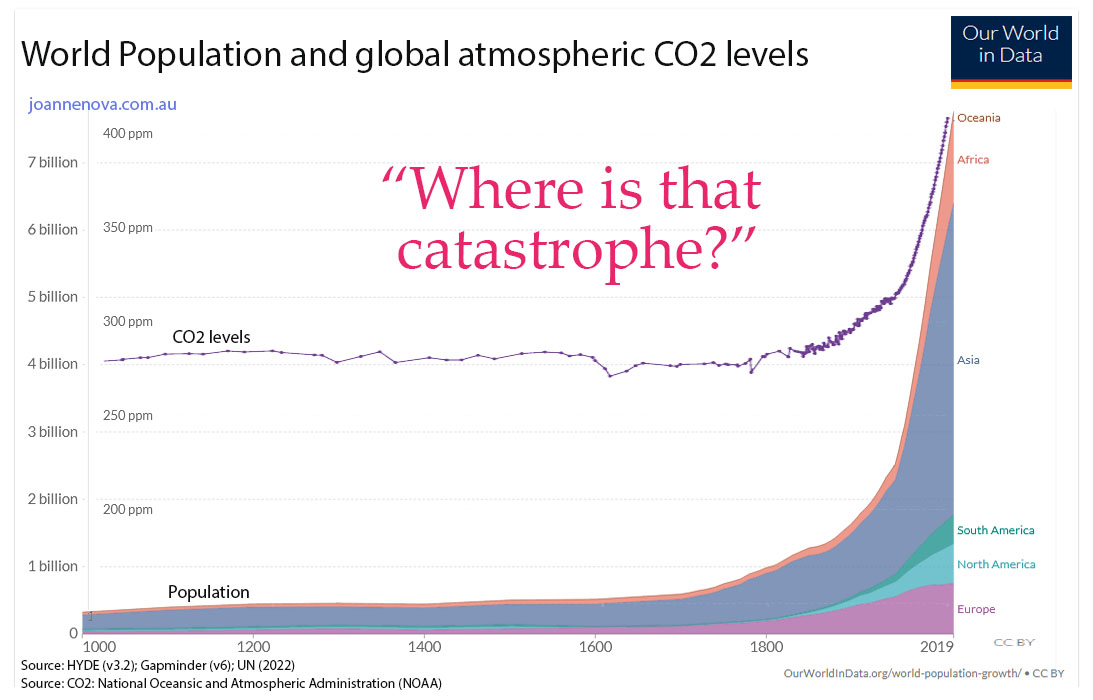
https://ourworldindata.org/grapher/world-population-by-region-with-...
https://ourworldindata.org/grapher/cumulative-co-emissions
*If the top 39 countries* on the Human Development Index pay up, the cost is split among 1.1 billion people.
Why stop at 39 countries? The 40th nation was Saudi Arabia! They won’t pay a cent?
CO2 Increases Biomass and Crop Growth
.
The world's temperature increases, ice melts, more land has more biomass, CO2 in the atmosphere increases
Increased CO2 comes after a temperature increase!!
The CO2 fertilization effect, or carbon fertilization effect, causes an increased rate of photosynthesis while limiting leaf transpiration in plants.
Both processes result from increased levels of atmospheric carbon dioxide (CO2)
https://en.wikipedia.org/wiki/CO2_fertilization_effect
Gas Components in Dry Air
Air is a mixture of several gases. The two most dominant components in dry air are about 21 vol% oxygen and about 78 vol% nitrogen.
The molar mass of oxygen gas is 31.999 g/mol and of nitrogen gas is 28.013 g/mol.
The CO2 value in table 1 is 414.24 ppm for 2020, per MLO
The molar mass of dry air is 28.9647 g/mol. See table 1
Air is usually modeled as a uniform (no variation, no fluctuation) gas with properties averaged from the individual components.
The water or vapor content in air varies.
Clouds consist of water droplets and water vapor.
Cloud cover and water vapor are the major controllers of the world’s temperatures
The maximum moisture carrying capacity of air depends primarily on temperature
The composition of air is unchanged until elevation of approximately 10,000 m
The average air temperature decreases at the rate of 0.6 C for each 100 m vertical height
"One Standard Atmosphere" is defined as the pressure equivalent of a 760 mm column of mercury, at 0 C sea level, and at standard gravity (32.174 ft/sec2)
Table 1 |
|
|
|
|
Name |
Symbol |
Fraction |
Mol wgt |
Mol wgt |
% |
g/mol |
g/mol of air |
||
Nitrogen |
N2 |
0.7808400 |
28.013 |
21.87367 |
Oxygen |
O2 |
0.2094600 |
31.999 |
6.70251 |
Argon |
Ar |
0.0093400 |
39.948 |
0.37311 |
Carbon dioxide |
CO2 |
0.0004142 |
44.010 |
0.01823 |
Neon |
Ne |
0.0000182 |
20.180 |
0.00037 |
Helium |
He |
0.0000052 |
4.003 |
0.00002 |
Methane |
CH4 |
0.0000018 |
16.042 |
0.00003 |
Krypton |
Kr |
0.0000010 |
83.798 |
0.00008 |
Hydrogen |
H2 |
0.0000005 |
2.016 |
0.00000 |
Xenon |
Xe |
0.0000001 |
131.293 |
0.00001 |
1.0000810 |
28.9647 |
Table 2 shows the gigatons of CO2 emissions from fossil fuels and industry for the years 1971 to 2020.
See URL
https://www.statista.com/statistics/276629/global-co2-emissions/
The Gt CO2/ppm was calculated as follows:
Weight of atmosphere is 5.148 x 10^18 kg
The atmosphere consists of 5.148 x 10^18 kg / 0.0289647 kg/mol = 177.7 x 10^18 moles.
Hence, 1 ppm is 177.7 x 10^12 moles.
The mass of 1 ppm of CO2 is 177.7 x 10^12 moles x 44.01 g/mole = 7821 x 10^12 g, or 7.821 billion metric tons, or 7.821 Gt
https://www.quora.com/How-many-metric-tons-of-CO2-is-1-ppm-in-our-a...
https://ui.adsabs.harvard.edu/abs/2005JCli...18..864T/abstract
The last column shows the CO2 ppm increase for each year, per the Mount Loa Observatory, MLO
The CO2 values, per MLO, include decay and absorption effects
Table 2, Human only |
As reported |
As reported |
Per MLO |
Per MLO |
||
Fossil and Industry |
CO2 |
CO2 |
CO2 |
CO2 |
CO2 |
|
Gt |
Gt/ppm |
ppm |
ppm |
ppm |
% |
|
1970 |
325.68 |
|||||
1971 |
15.50 |
7.821 |
1.98 |
326.32 |
0.64 |
32.3 |
16.22 |
7.821 |
2.07 |
327.46 |
1.14 |
55.0 |
|
17.08 |
7.821 |
2.18 |
329.68 |
2.22 |
101.7 |
|
17.01 |
7.821 |
2.17 |
330.19 |
0.51 |
23.4 |
|
17.05 |
7.821 |
2.18 |
331.13 |
0.94 |
43.1 |
|
17.98 |
7.821 |
2.30 |
332.03 |
0.90 |
39.1 |
|
18.47 |
7.821 |
2.36 |
333.84 |
1.81 |
76.6 |
|
19.07 |
7.821 |
2.44 |
335.41 |
1.57 |
64.4 |
|
19.61 |
7.821 |
2.51 |
336.84 |
1.43 |
57.0 |
|
19.49 |
7.821 |
2.49 |
338.76 |
1.92 |
77.0 |
|
1981 |
19.05 |
7.821 |
2.44 |
340.12 |
1.36 |
55.8 |
18.88 |
7.821 |
2.41 |
341.48 |
1.36 |
56.3 |
|
19.00 |
7.821 |
2.43 |
343.15 |
1.67 |
68.7 |
|
19.66 |
7.821 |
2.51 |
344.87 |
1.72 |
68.4 |
|
20.32 |
7.821 |
2.60 |
346.35 |
1.48 |
57.0 |
|
20.62 |
7.821 |
2.64 |
347.61 |
1.26 |
47.8 |
|
21.27 |
7.821 |
2.72 |
349.31 |
1.70 |
62.5 |
|
22.10 |
7.821 |
2.83 |
351.69 |
2.38 |
84.2 |
|
22.41 |
7.821 |
2.87 |
353.20 |
1.51 |
52.7 |
|
22.75 |
7.821 |
2.91 |
354.45 |
1.25 |
43.0 |
|
1991 |
23.24 |
7.821 |
2.97 |
355.70 |
1.25 |
42.1 |
23.57 |
7.821 |
3.01 |
356.54 |
0.84 |
27.9 |
|
22.80 |
7.821 |
2.92 |
357.21 |
0.67 |
23.0 |
|
22.96 |
7.821 |
2.94 |
358.96 |
1.75 |
59.6 |
|
23.45 |
7.821 |
3.00 |
360.97 |
2.01 |
67.0 |
|
24.15 |
7.821 |
3.09 |
362.74 |
1.77 |
57.3 |
|
24.30 |
7.821 |
3.11 |
363.88 |
1.14 |
36.7 |
|
24.21 |
7.821 |
3.10 |
366.84 |
2.96 |
95.6 |
|
24.52 |
7.821 |
3.14 |
368.54 |
1.70 |
54.2 |
|
25.23 |
7.821 |
3.23 |
369.71 |
1.17 |
36.3 |
|
2001 |
25.45 |
7.821 |
3.25 |
371.32 |
1.61 |
49.5 |
26.04 |
7.821 |
3.33 |
373.45 |
2.13 |
64.0 |
|
27.37 |
7.821 |
3.50 |
375.98 |
2.53 |
72.3 |
|
28.63 |
7.821 |
3.66 |
377.70 |
1.72 |
47.0 |
|
29.60 |
7.821 |
3.78 |
379.98 |
2.28 |
60.2 |
|
30.58 |
7.821 |
3.91 |
382.09 |
2.11 |
54.0 |
|
31.49 |
7.821 |
4.03 |
384.02 |
1.93 |
47.9 |
|
32.07 |
7.821 |
4.10 |
385.83 |
1.81 |
44.1 |
|
31.61 |
7.821 |
4.04 |
387.84 |
2.01 |
49.7 |
|
33.34 |
7.821 |
4.26 |
390.10 |
2.26 |
53.0 |
|
2011 |
34.47 |
7.821 |
4.41 |
391.85 |
1.75 |
39.7 |
34.97 |
7.821 |
4.47 |
394.06 |
2.21 |
49.4 |
|
35.28 |
7.821 |
4.51 |
396.74 |
2.68 |
59.4 |
|
35.53 |
7.821 |
4.54 |
398.81 |
2.07 |
45.6 |
|
35.50 |
7.821 |
4.54 |
401.01 |
2.20 |
48.5 |
|
35.45 |
7.821 |
4.53 |
404.41 |
3.40 |
75.0 |
|
35.93 |
7.821 |
4.59 |
406.76 |
2.35 |
51.2 |
|
36.65 |
7.821 |
4.69 |
408.72 |
1.96 |
41.8 |
|
36.70 |
7.821 |
4.69 |
411.66 |
2.94 |
62.7 |
|
2020 |
34.81 |
7.821 |
4.45 |
414.24 |
2.58 |
58.0 |
1971 to 2020 |
1273.44 |
7.821 |
162.82 |
88.56 |
54.4 |
Table 3 shows the CO2 ppm in the atmosphere, for 1971 and 2020, and the ppm increase, per MLO
Table 3, Human only |
|
Average CO2 ppm, 2020, per MLO |
414.24 |
Average CO2 ppm, 1970, per MLO |
325.68 |
Average CO2 ppm increase |
88.56 |
Carbon in the Atmosphere
C14, trace, is a radioactive isotope, produced by cosmic rays, and atomic bomb testing.
C13, 1%, is stable, came from natural sources, such as volcanos and biomass decay
C12, 99%, is stable, came from burning fossil fuel sources
NOTE: Volcanos are a major source of SO2, that increases diffuse solar radiation, that increases photo-synthesis, which absorbs CO2.
About 162.82 ppm of CO2 was officially emitted by fossil fuel and industry from 1971 to 2020, per Statista.
Other human sources of CO2 were 11%, or 27.56 ppm, per EPA. See URL
The measured increase of CO2 in atmosphere was 88.56 ppm, per MLO
https://www.epa.gov/ghgemissions/global-greenhouse-gas-emissions-data
World CO2 Emissions and Absorptions
Friedlingstein, et al, Page 4: “total anthropogenic CO2 emission due to fossil, industrial processes (including cement), forestry, other land use, and land use changes of 10.2 ± 0.8 gigaton of carbon in 2020, or 37.4 ± 2.9 Gt CO2/y”
https://essd.copernicus.org/articles/12/3269/2020/
This is not net emissions, because absorption of CO2 by various sinks was not subtracted.
The image shows the two major sources and the three major sinks.
We do not know how much of the 37.4 Gt CO2 human emission was absorbed during 2020.
NOTE: US EPA reports about 9.0 Gt of Carbon, or 44/12 x 9 = 33 Gt CO2, in 2020
https://www.epa.gov/ghgemissions/global-greenhouse-gas-emissions-data
.
The data source of CO2 in the atmosphere, is collected by the NOAA Mauna Loa Observatory, MLO, (no estimates, no theories, no models, no assumptions.)
The data is reported in micromoles/mole = ppm.
MLO did not report CO2 flask measurements on Jan 1, 2020
MLO reported 4 CO2 flask measurements for Jan 2, 2020. Average 412.9875 ppm
MLO reported 4 CO2 flask measurement for Dec 31, 2020. Average 415.5225 ppm
For 2020, CO2 increase, from all sources, human + natural - absorption, was 2.535 ppm, or 2.535 ppm CO2 x 7.821 Gt CO2/ppm = 19.826 Gt CO2
Oceans are a CO2 Sink and a Source
It is easily proven, and observed, the oceans are both a CO2 sink and a source.
CO2 flux is non-stop in both directions, into and out of Earth’s surface.
The Earth’s surface is about 71% ocean. CO2 gas molecules continuously collide with ocean surface, day and night, regardless of season, temperature, or location; some of that CO2 is emitted back into air, and some is retained in the surface.
The partition ratio of CO2 between gas in the surface versus gas just above the surface is the Henry’s Law coefficient.
The coefficient is the ratio of CO2 moles in air and water; it varies only with the local surface temperature.
Adding more CO2 to the air, or to the ocean surface, does not change the CO2 ratio.
Humans, volcanoes/fissures (on land and ocean floor), biosphere, etc., adding CO2 to the atmosphere does not change the Henry’s ratio or diffusion of the CO2 gas into the ocean surface.
The concentration of CO2 gas in the ocean surface and in the air, at a specific local surface temperature, is given by the Henry’s Law coefficient, plus or minus temporary perturbations due to alkalinity, surface or air disturbances, due to winds, currents, and salinity at that location.
The net amount of biosphere CO2 flux, another perturbation, is also non-stop in both directions when CO2 emissions due to decay are included.
These perturbations adjust by CO2 emission or absorption, and rapidly return to the Henry’s Law CO2 partition ratio.
Nature, which balances 3224.455 Gt CO2 total CO2 in atmosphere by continuous emissions and absorptions, likely is able to balance an additional 37.4 Gt CO2 (not adjusted for absorption) from humans.
The CO2 ppm in air, per MLO, measures the net effect of emissions - absorption
Human emissions would also be the net effect of emissions – absorption, if there were a method to measure it
Ideally, we should compare these two data sets, but we cannot, because there is no method to measure absorption of human CO2
.
CO2 Emissions, Absorptions, Absorption Ratio From 1971 to 2020, 50 years
Human CO2 emissions were 1273.44 Gt, as reported by governments, per Statista
In addition, there was CO2 from natural sources, such as forest fires, oceans, wetlands, permafrost, mud volcanoes, on land and underwater volcanoes, and earthquakes.
The estimated quantity of natural emissions is about 29.07 Gt per year, or 50 x 29.07 = 1453.5 Gt during 50 years, or 185.85 ppm. See URL
The natural emissions have been in balance from at least the year 1 of the Christian Era. to about 1900, with atmospheric CO2 at an average of 280 +/- ppm. See below image
This finding indicates the human emissions impose an extra load on the self-balancing Earth system.
https://www.sciencedirect.com/science/article/pii/S1674927818300376
Added to Atmosphere = 162.82 ppm, human + 185.85 ppm, natural = 348.67 ppm
Net added to atmosphere = 88.56, which includes any decay. per MLO
Added to Ocean and Land = 348.67 ppm – 88.56 ppm = 260.11 ppm
Net added to Atmosphere/Added to Ocean and Land = 88.56/260.11 = 34.0%, a 50-y average
NOTE: The COVID pandemic lasted about 18 months, say from Jan. 1, 2020 to Jul, 1, 2021
In 2020
The human CO2 emissions were reported at 34.81 Gt, which reflected COVID shutdowns, per Statista, See table 2
The natural CO2 emissions were about 29.07 Gt. See URL
Total CO2 emissions were 63.88 Gt
https://www.sciencedirect.com/science/article/pii/S1674927818300376
MLO measured an increase of 2.58 ppm, or 2.58 x 7.821 = 20.18 Gt. See table 2
About 20.18/63.88 = 31.5% was absorbed by atmosphere, the rest by ocean and land
During COVID, there likely was a reduction in human CO2 of about 10%, or about 3.481 GT, of which 31.5%, or 1.10 Gt, or 0.14 ppm, was not added to atmosphere
That little change would disappear in MLO error bands
Table 4/CO2 during 50 y |
|
CO2 |
CO2, ppm |
Natural |
50 x 29.07 |
1453.5 |
185.85 |
Human, as reported |
162.82 x 7.821 |
1273.42 |
162.82 |
Total |
2726.92 |
348.67 |
|
|
|||
Net added to Atmosphere, per MLO |
88.56 x 7.821 |
692.63 |
88.56 |
Added to Ocean, Land |
260.11 x 7.821 |
2034.29 |
260.11 |
Total |
2726.92 |
348.67 |
.
Equilibrium of Natural CO2 During Medieval and Present Warm Periods, 950 - 2000
There are natural sources of atmospheric CO2, such as outgassing from the ocean, decomposing of flora, venting from on-land and under-ocean volcanoes, naturally occurring wildfires, and belches from ruminant animals.
These sources of CO2 are offset by “sinks”, such as photosynthesis by plants on land and in the ocean, direct absorption into the ocean, and the creation of soil and peat.
Atmospheric CO2 has varied from a peak of 285 ppm to a low of 270 ppm, due to natural sources, until about 1850.
As the world emerged from the Little Ice Age, from the lowest temperature at about 1700, the increasing temperatures enhanced growth of biomass, melted tundras and glaciers, exposed more soil to sunlight, warmed the land and ocean surface temperature, etc., and a new equilibrium developed at about 295 ppm in the atmosphere.
Starting about 1850, CO2 from fossil fuels and industry and other human sources added to the ppm in the atmosphere. See URL
https://wattsupwiththat.com/2023/04/14/co2-budget-model-update-thro...
This URL provides several images of temperature and CO2 ppm data from 950 AD to present.
https://agupubs.onlinelibrary.wiley.com/doi/full/10.1029/2011GB004247
.
.
SUPPLEMENTARY ARTICLES
.
ISO-NE REPORT OF 2021 ECONOMIC STUDY: FUTURE GRID RELIABILITY STUDY PHASE 1
https://www.iso-ne.com/static-assets/documents/2022/07/2021_economi...
DEEP DIVE SUMMARY OF THE ISO-NE REPORT
https://www.utilitydive.com/news/new-england-future-grid-study-iso/...
CO2 IS INNOCENT, BUT CLOUD COVER IS GUILTY
https://wattsupwiththat.com/2022/11/23/co2-is-innocent-but-clouds-a...
LIFE WITHOUT OIL?
Life without oil means many products that are made with oil, such as the hundreds listed below, would need to be provided by wind and solar and hydro.
Folks, including Biden's handlers, wanting to get rid of fossil fuels, such as crude oil, better start doing some rethinking.
The above also applies to natural gas, which is much preferred by many industries, such as glass making
If you do not have abundant low-cost energy, you cannot have modern industrial economies.
Without Crude Oil, there can be no Electricity.
Every experienced engineer knows, almost all the parts of wind, solar and battery systems, for electricity generation and storage, from mining materials to manufacturing parts, to installation and commissioning, in addition to the infrastructures that produce materials, parts, specialized ships, etc., are made from the oil derivatives manufactured from raw crude oil.
There is no escaping of this reality, except in green lalaland.
APPENDIX 1
These articles contain significant information regarding wind, solar and grid-scale battery systems
GRID-SCALE BATTERY SYSTEMS IN NEW ENGLAND TO COUNTERACT SHORTFALL OF ONE-DAY WIND/SOLAR LULL
https://www.windtaskforce.org/profiles/blogs/grid-scale-battery-sys...
COLD WEATHER OPERATION IN NEW ENGLAND DECEMBER 24, 2017 TO JANUARY 8, 2018
https://www.windtaskforce.org/profiles/blogs/cold-weather-operation...
ANALYSIS OF WIND AND SOLAR ENERGY LULLS AND ENERGY STORAGE IN GERMANY
https://www.windtaskforce.org/profiles/blogs/wind-and-solar-energy-...
IRELAND FUEL AND CO2 REDUCTIONS DUE TO WIND ENERGY LESS THAN CLAIMED
https://www.windtaskforce.org/profiles/blogs/fuel-and-co2-reduction...
BATTERY SYSTEM CAPITAL COSTS, OPERATING COSTS, ENERGY LOSSES, AND AGING
https://www.windtaskforce.org/profiles/blogs/battery-system-capital...
HIGH COSTS OF WIND, SOLAR, AND BATTERY SYSTEMS IN US NORTHEAST
https://www.windtaskforce.org/profiles/blogs/high-costs-of-wind-sol...
CO2 IS A LIFE GAS; NO CO2 = NO LIFE
https://www.windtaskforce.org/profiles/blogs/co2-is-a-life-gas-no-c...
APPENDIX 2
These articles explain a lot about the world-wide “Climate Crisis” scam, based on highly compromised surface station measurements, which typically read HIGH.
Climate scientists SUBJECTIVELY adjust the readings for use in their SUBJECTIVE computerized-temperature-calculation programs, which are used in the reports of IPCC, etc., for scare-mongering purposes.
New Surface Stations Report Released – It’s ‘worse than we thought’
https://www.windtaskforce.org/profiles/blogs/new-surface-stations-r...
Weather- Just how does it happen?
https://www.windtaskforce.org/profiles/blogs/weather-just-how-does-...
A summary of the results of three “Physics of the Earth’s Atmosphere” papers, which were submitted for peer review at the Open Peer Review Journal.
https://globalwarmingsolved.com/2013/11/19/summary-the-physics-of-t...
APPENDIX 3
Satellites and balloons measure temperatures of the Troposphere, which starts at ground level, and has an average height of 59,000 ft at the tropics, 56,000 ft at the middle latitudes, and 20,000 ft at the poles. Above those levels starts the Stratosphere.
Balloons directly measure temperatures. Satellites measure radiation, from which temperatures are calculated.
Both consistently measure much lower temperatures than the average of 102 computer-generated graphs.
See Appendix 2 and 3
The data in the below images is for a 43-y period.
There is global warming, but it is not anywhere near as much as scare-mongers are claiming.
https://www.windtaskforce.org/profiles/blogs/grid-scale-battery-sys...
1) Objective satellite and balloon temperatures increased from 0.00 to 0.5 C, or, or 0.116 C/decade
2) Subjective computer-generated temperatures increased from 0.00 to 1.20 C; or 0.28 C/decade, about 2.7 TIMES AS FAST
The temperature data by satellites and balloons are more accurate than land-based measurements.
See Appendix 2 and URL
https://en.wikipedia.org/wiki/UAH_satellite_temperature_dataset
Satellite measurements are made many times during every day and systematically cover almost the entire world; +/- 85-degree latitude.
The satellite data is vastly more complete, and accurate than would be gathered by ground stations. (See Appendix 2)
Balloon measurements, made on a sampling basis, are vastly less complete than satellite measurements, but they serve as a useful crosscheck on the satellite measurements.
NOTE: Behind the 102 computer graphs are hundreds of organizations that likely receive a significant part of their revenues from governments and subsidy-receiving wind, solar, battery, etc., businesses.
The livelihood and career prospects of the people creating these graphs is more secure, if they aim high, rather than low.
https://www.scienceunderattack.com/blog/2021/2/22/latest-computer-c...
A more detailed view of satellite temperatures.
APPENDIX 4
Science and Environmental Policy Project (SEPP) and also a member of the CO2 Coalition. Sheahen and the Coalition are collaborating on a brief.
SEPP’s October 8 newsletter contains a summary of a major 2021 paper by Happer and co-author William van Wijngaarden that completely undermines the fake “science” the IPCC and EPA used to support the case of climate alarm.
Sheahen specifically discusses the efforts of Professors William van Wijngaarden and William Happer in their pioneering work in calculating the real-world Global Warming Potentials (GWPs) of the five most common Green-House Gases (GHGs).
Sheahan explains why the approach used by IPCC is faulty, but nonetheless used by its followers, such as the US National Center for Atmospheric Research (NCAR) and the EPA.
These faulty methods lead to great exaggeration of the greenhouse effect of carbon dioxide, methane, and other minor greenhouse gases. . . .
Sheahan shows the stunning agreement between the calculations of van Wijngaarden and Happer (W & H) with satellite measurements (and balloon measurements) of outgoing infrared radiation emitted by the earth to space . . .
Sheahan claims, because of the exceptionally good agreement between observational data and the calculations of W & H, we can conclude the W&H model has been validated.
The W&H model embodies the scientific method.
In that case, it is reasonable to use it to study other hypothetical cases.
It is not possible to do so with IPCC models, which have never achieved agreement with observations. . .
See Appendix 3
The gist of the H&W work is the greenhouse effect of CO2 in the atmosphere is almost entirely saturated, such that any additional CO2 can have almost no additional warming effect.
Here is a chart prepared by Sheahan to illustrate the H&W results.
As atmospheric CO2 increases, say from 380 to 420 ppm, it has less warming effect.
The most warming effect occurs at very low levels of CO2, say 20 to 60 ppm.
APPENDIX 5
A timely and important new paper has just been uploaded to the CO2 Coalition website on nitrogen.
The first half of the paper on the greenhouse warming effect of N2O is quite technical
It is summarized in the first link.
Link to the full paper is at the bottom. Please distribute widely.
Authors: Will Happer, C. A. de Lange, William Wijngaarden and J.D. Ferguson
Nitrous Oxide and Climate – Why restricting N2O emissions is unnece...
Nitrous oxide (N20) has now joined carbon dioxide (CO2) and methane (CH4) in the pantheon of “human-generated demon” gases.
GW scare-mongers view increasing concentrations of these molecules are leading to unusual and unprecedented GW, which will lead to catastrophic consequences for both our ecosystems and humanity.
Countries around the world are in the process of greatly reducing, or eliminating, the use of nitrogen fertilizers, based on heretofore poorly understood properties of nitrous oxide.
Reductions of N2O emissions of 40 to 45 percent are being proposed in Canada , and by up to 50 percent in the Netherlands .
Sri Lanka’s complete ban on fertilizer in 2021 led to the total collapse of their primarily agricultural economy.
The CO2 Coalition has published this paper, which evaluates the GW effect of the N20 and its role in the nitrogen cycle.
Policymakers can now proceed to make informed decisions about the costs and benefits of mandated N20 reductions of this beneficial molecule.
This new paper joins previous CO2 Coalition reports on other greenhouse gases, carbon dioxide and methane.
Key takeaways from the paper:
- At current rates, a doubling of N2O would occur in more than 400 years.
- Atmospheric warming by N2O is estimated to be 0.064 C per century.
- Increasing crop production requires continued application of synthetic nitrogen fertilizer to feed a growing population.
Download the entire PDF Nitrous Oxide
Methane, CH4, aka, natural gas
https://wattsupwiththat.com/2022/11/19/methane-much-ado-about-nothing/
NOTE: A similar graph can be created for N2O
It is dangerous to be correct in matters, where established men are wrong, by Voltaire
You need to be a member of Citizens' Task Force on Wind Power - Maine to add comments!
Join Citizens' Task Force on Wind Power - Maine