
Influential elites are either in denial about the horrifying costs and consequences of Net Zero – witness last Wednesday’s substantial vote against fracking British gas in the House of Commons – or busy scooping up the almost unlimited amounts of money currently on offer for promoting pseudoscience, climate scares, and investing in impractical green technologies.
Until the lights start to go out, and heating fails, those elites are unlikely to pay much attention to a recent 1,000 page alternative energy investigation, undertaken for a Finnish Government agency by Associate Professor Simon Michaux.
Referring to the UK's 2050 Net-Zero target, Michaux states there is “simply not enough time, nor enough resources to do this by 2050”
One Example Where Net-Zero Cannot be Achieved
Michaux notes, “in theory”, there are enough global reserves of nickel and lithium, if they are exclusively used to produce batteries for electric vehicles. But there is not enough already-discovered cobalt, and more will need to be discovered.
It gets much worse.
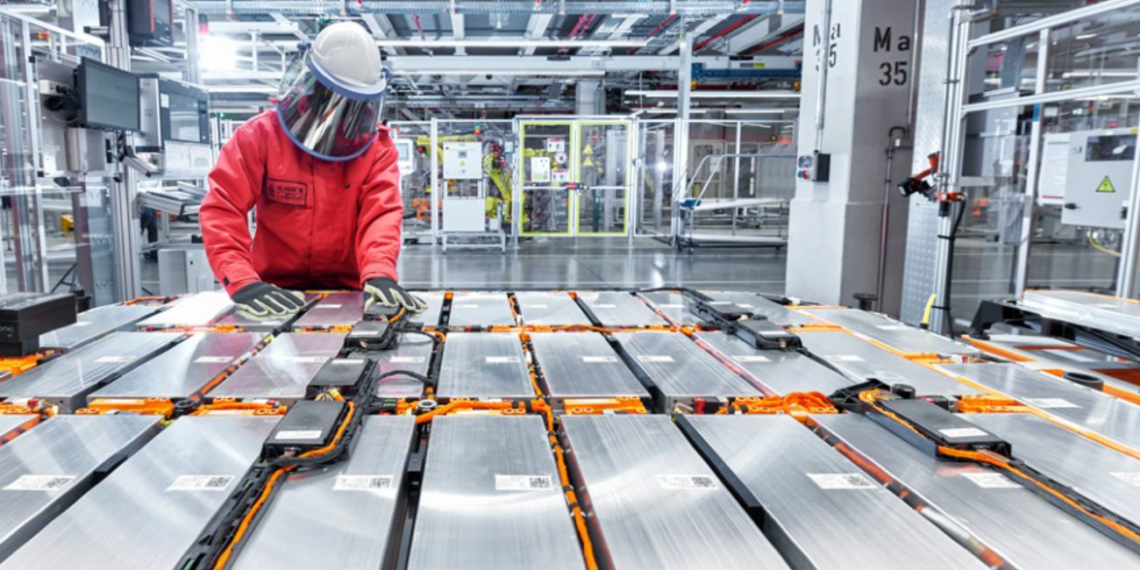
EV battery packs have a useful working life of only 8 to 10 years, so about 150 million replacement EVs will need to be produced each year.
It make no economic sense to spend $20,000 to replace a battery pack in an 8-y-old EV that had an original cost of, say $35,000 to $45,000
“This is unlikely to be practical, which suggests the whole EV battery solution needs to be re-thought, and a new solution needs to be developed that is not so mineral intensive,” he says.
All of these problems occur in finding a mass of lithium-ion batteries weighting 286.6 million metric ton.
But a “power buffer” of another 2.5 billion mt of grid-scale battery systems is required to provide a four-week back-up for weather-dependent, variable, intermittent, wind and solar electricity.
Of course, such mineral quantities are not available from global mineral reserves.
Michaux states: "It is not clear how such an extremely expensive wind/solar buffer could be delivered with any alternative system.
Remember, the utility-grade, buffer battery systems would last about 15 years!!
THIS IS A HUGE COST THAT SHOULD BE ADDED TO THE COST OF WIND AND SOLAR
THOSE BUFFER BATTERIES WOULD ALSO COUNTERACT THE UP/DOWN OUTPUT OF WIND AND SOLAR, AND WOULD PROVIDE ELECTRICITY WHEN MOTHER NATURE’s WIND AND SOLAR ARE INSUFFICIENT
Any electricity charged into the battery would have about an 18 to 20 percent loss coming out of the battery, on an A to Z basis
Michaux sounds a clear warning message.
Current expectations are global industrial businesses will replace a complex industrial energy ecosystem that took more than a century to build.
It was built with the support of the highest calorifically dense source of energy the world has ever known (oil), in cheap abundant quantities, with easily available credit and seemingly unlimited mineral resources.
The replacement, he notes, needs to be done, while: 1) energy costs are near historic highs, 2) the world's financial systems saturated in debt, and 3) not enough minerals.
All of it has to be done within a few decades to "save the planet".
Based on his copious calculations, the author opines, that humongous task likely will not go as Net-Zero folks are dreaming about
Gloom/Doom 96-y-old Crackpot Pontificating
Last Sunday, Sir David Attenborough concluded six episodes of pseudo-scientific, green-agitprop Frozen Planet II, by demanding the world embrace Net Zero, “no matter how challenging it may be”.
Net Zero is a political, centralized command/control project, the full horror of which is yet to be inflicted on the general population.
Lifestyle Adjustments
Michaux is quite clear what it entails: “What may be required is a significant reduction of societal demand for all resources, of all kinds, i.e., lifestyle changes, rationing, eating bugs, while freezing in the dark.
This implies a very different social contract, and a radically different system of governance to what is in place today.”
China as an Example
Of course, a radically different system of government is available in the People’s Republic of China, but here the position on Net Zero is a tad more nuanced.
Having lifted about a billion people out of starving poverty in the last 40 years, and become the workshop for an increasingly complacent Western world – almost all powered by fossil fuel ,and hydro, and nuclear power – the Holy Grail of the Net-Zero Quest does not seem so pressing.
Speaking to the Communist Party Congress earlier this week, President Xi Jinping sounded a note of caution and said: “prudence” would govern China’s efforts to peak and eventually zero-out CO2 emissions.
All of this would be in line with the principle of “getting the new before discarding the old”.
Meanwhile, China’s coal production is reported to have reached record levels, while the Chinese Congress was told oil and gas exploration/development will be expanded, as part of measures to ensure “energy security”.
Fossil Fuels Provide 85% of all World Energy
Michaux points out, nearly 85% of world energy comes from fossil fuel. By his calculations, the annual global production of non-fossil electricity will need to quadruple to 37,670.6 TWh/y.
In a recent report for the Global Warming Policy Foundation (GWPF), Professor Michael Kelly estimates, the UK electricity grid would have to expand by 2.7 times.
This will involve adding capacity at eight times the rate it has been added over the last 30 years.
If calculations are made for the need to rewire homes, streets, local substations and power lines to carry the new capacity, the extra cost will be nearly £1 trillion.
In another recent GWPF paper, the energy writer John Constable warned, the European Green Deal seems all but certain to break Europe’s economic and socio-political power, “rendering it a trivial and incapable backwater, reliant on – and subservient to – superior powers”.
The US, a superior power, with ample natural resources, is using NATO to weaken, not Russia, but Europe, which lacks natural resources.
History provides us with many examples of weak, or weakened, tribes being overrun by stronger tribes. In the animal kingdom it is known as natural evolution.
A 96-year old gloom and doom crackpot intones, “we have to pay any price to satisfy the new Net-Zero cult of the green god.”
Better cost estimates and more rational views have been available for decades.
Chris Morrison is the Daily Sceptic’s Environment Editor.
APPENDIX
.
ISO-NE REPORT OF 2021 ECONOMIC STUDY: FUTURE GRID RELIABILITY STUDY PHASE 1
https://www.iso-ne.com/static-assets/documents/2022/07/2021_economi...
DEEP DIVE SUMMARY OF THE ISO-NE REPORT
https://www.utilitydive.com/news/new-england-future-grid-study-iso/...
LIFE WITHOUT OIL
Life without oil means many products that are made with oil, such as the hundreds listed below, would need to be provided by wind and solar and hydro.
Folks, including Biden's attendants, wanting to get rid of fossil fuels, such as crude oil, better start doing some rethinking.
The above also applies to natural gas, which is much preferred by many industries
If you do not have abundant low-cost energy, you cannot have modern industrial economies.
APPENDIX 1
These articles contain significant information regarding wind, solar and grid-scale battery systems
GRID-SCALE BATTERY SYSTEMS IN NEW ENGLAND TO COUNTERACT SHORTFALL OF ONE-DAY WIND/SOLAR LULL
https://www.windtaskforce.org/profiles/blogs/grid-scale-battery-sys...
COLD WEATHER OPERATION IN NEW ENGLAND DECEMBER 24, 2017 TO JANUARY 8, 2018
https://www.windtaskforce.org/profiles/blogs/cold-weather-operation...
ANALYSIS OF WIND AND SOLAR ENERGY LULLS AND ENERGY STORAGE IN GERMANY
https://www.windtaskforce.org/profiles/blogs/wind-and-solar-energy-...
IRELAND FUEL AND CO2 REDUCTIONS DUE TO WIND ENERGY LESS THAN CLAIMED
https://www.windtaskforce.org/profiles/blogs/fuel-and-co2-reduction...
BATTERY SYSTEM CAPITAL COSTS, OPERATING COSTS, ENERGY LOSSES, AND AGING
https://www.windtaskforce.org/profiles/blogs/battery-system-capital...
HIGH COSTS OF WIND, SOLAR, AND BATTERY SYSTEMS IN US NORTHEAST
https://www.windtaskforce.org/profiles/blogs/high-costs-of-wind-sol...
APPENDIX 2
These articles explain a lot about the world-wide “Climate Crisis” scam, based on highly compromised surface station measurements, which typically read HIGH.
Climate scientists SUBJECTIVELY adjust the readings for use in their SUBJECTIVE computerized-temperature-calculation programs, which are used in the reports of IPCC, etc., for scare-mongering purposes.
New Surface Stations Report Released – It’s ‘worse than we thought’
https://www.windtaskforce.org/profiles/blogs/new-surface-stations-r...
Weather- Just how does it happen?
https://www.windtaskforce.org/profiles/blogs/weather-just-how-does-...
A summary of the results of three “Physics of the Earth’s Atmosphere” papers, which were submitted for peer review at the Open Peer Review Journal.
https://globalwarmingsolved.com/2013/11/19/summary-the-physics-of-t...
APPENDIX 3
Satellites and balloons measure temperatures of the Troposphere, which starts at ground level, and has an average height of 59,000 ft at the tropics, 56,000 ft at the middle latitudes, and 20,000 ft at the poles. Above those levels starts the Stratosphere.
Balloons directly measure temperatures. Satellites measure radiation, from which temperatures are calculated.
Both consistently measure much lower temperatures than the average of 102 computer-generated graphs.
See Appendix 2 and 3
The data in the below images is for a 43-y period.
There is global warming, but it is not anywhere near as much as scare-mongers are claiming.
https://www.windtaskforce.org/profiles/blogs/grid-scale-battery-sys...
1) Objective satellite and balloon temperatures increased from 0.00 to 0.5 C, or, or 0.116 C/decade
2) Subjective computer-generated temperatures increased from 0.00 to 1.20 C; or 0.28 C/decade, about 2.7 TIMES AS FAST
The temperature data by satellites and balloons are more accurate than land-based measurements.
See Appendix 2 and URL
https://en.wikipedia.org/wiki/UAH_satellite_temperature_dataset
Satellite measurements are made many times during every day and systematically cover almost the entire world; +/- 85-degree latitude.
The satellite data is vastly more complete, and accurate than would be gathered by ground stations. (See Appendix 2)
Balloon measurements, made on a sampling basis, are vastly less complete than satellite measurements, but they serve as a useful crosscheck on the satellite measurements.
NOTE: Behind the 102 computer graphs are hundreds of organizations that likely receive a significant part of their revenues from governments and subsidy-receiving wind, solar, battery, etc., businesses.
The livelihood and career prospects of the people creating these graphs is more secure, if they aim high, rather than low.
https://www.scienceunderattack.com/blog/2021/2/22/latest-computer-c...
A more detailed view of satellite temperatures.
APPENDIX 4
Science and Environmental Policy Project (SEPP) and also a member of the CO2 Coalition. Sheahen and the Coalition are collaborating on a brief.
SEPP’s October 8 newsletter contains a summary of a major 2021 paper by Happer and co-author William van Wijngaarden that completely undermines the fake “science” the IPCC and EPA used to support the case of climate alarm. See URL
https://wvanwijngaarden.info.yorku.ca/files/2021/03/WPotency.pdf?x4...
Sheahen specifically discusses the efforts of Professors William van Wijngaarden and William Happer in their pioneering work in calculating the real-world Global Warming Potentials (GWPs) of the five most common Green-House Gases (GHGs).
Sheahan explains why the approach used by IPCC is faulty, but nonetheless used by its followers, such as the US National Center for Atmospheric Research (NCAR) and the EPA.
These faulty methods lead to great exaggeration of the greenhouse effect of carbon dioxide, methane, and other minor greenhouse gases.
Sheahan shows the stunning agreement between the calculations of van Wijngaarden and Happer (W & H) with satellite measurements (and balloon measurements) of outgoing infrared radiation emitted by the earth to space . . .
Sheahan claims, because of the exceptionally good agreement between observational data and the calculations of W & H, we can conclude the W&H model has been validated.
The W&H model embodies the scientific method, i.e., it is reasonable to use it to study other hypothetical cases.
It is not possible to do so with IPCC models, which have never achieved agreement with observations.
See Appendix 3
The gist of the H&W work is the greenhouse effect of CO2 in the atmosphere is almost entirely saturated, such that any additional CO2 can have almost no additional warming effect.
Here is a chart prepared by Sheahan to illustrate the H&W results.
As atmospheric CO2 increases, say from 380 to 420 ppm; the-40 ppm increase has about 0.05C warming effect.
As atmospheric CO2 increases, say from 20 to 60 ppm; the 40-ppm increase has about a 0.5C warming effect.
You need to be a member of Citizens' Task Force on Wind Power - Maine to add comments!
Join Citizens' Task Force on Wind Power - Maine