.
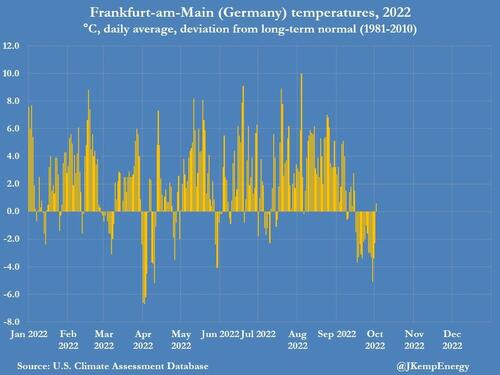
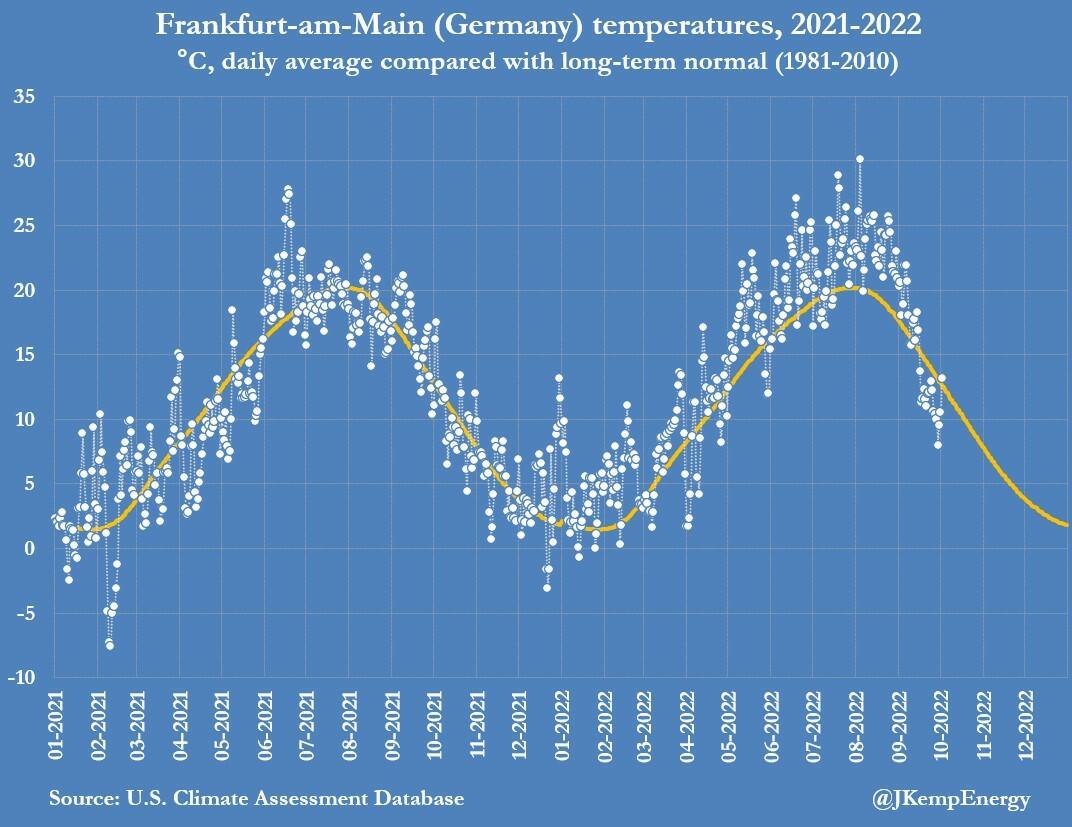
Late September and October temperatures were below normal, and November and December temperatures will be below normal, as predicted by ECMWF
.
.
Needless to say, the forecast - which is based on data from the ECMWF, and several other weather prediction systems, including those in the UK, US, France and Japan - is a major problem for European politicians, as they:
1) Try to contain soaring energy costs for businesses and households, due to ill-advised EU sanctions on Russia, which responded by huge cuts in gas deliveries to "unfriendly countries", and to
2) Moderate public anger and outrage at the coming freezing winter, where Europe has somehow promised to cut demand by as much as 20%, but nobody knows just how that would be done.
Adding insult to injury, Europe's fascination with wind and solar will once again be a huge disappointment:
Rabier said, recent hurricanes across the Atlantic could cause milder, wetter and windier weather in the short term. But cooler weather, later in the year, would be consistent with the atmospheric conditions known as La Niña, a weather pattern derived from the cooling of the Pacific Ocean’s surface, which drives changes in wind and rainfall patterns in different regions.
Of course, this could prove to be just another example of Europe being woefully wrong at forecasting, well, anything (just note the ECB's track record).
Weather in Europe is difficult to predict, as the conditions are dictated by several remote factors including winds in the tropical stratosphere and surface pressure across the Atlantic.
In any case, there is a faint silver-lining to Europe's coming deep freeze: as Reuters' reporter John Kemp reports, Europe is entering winter with a near-record volume of gas in storage after buying large volumes at almost any price during the summer.
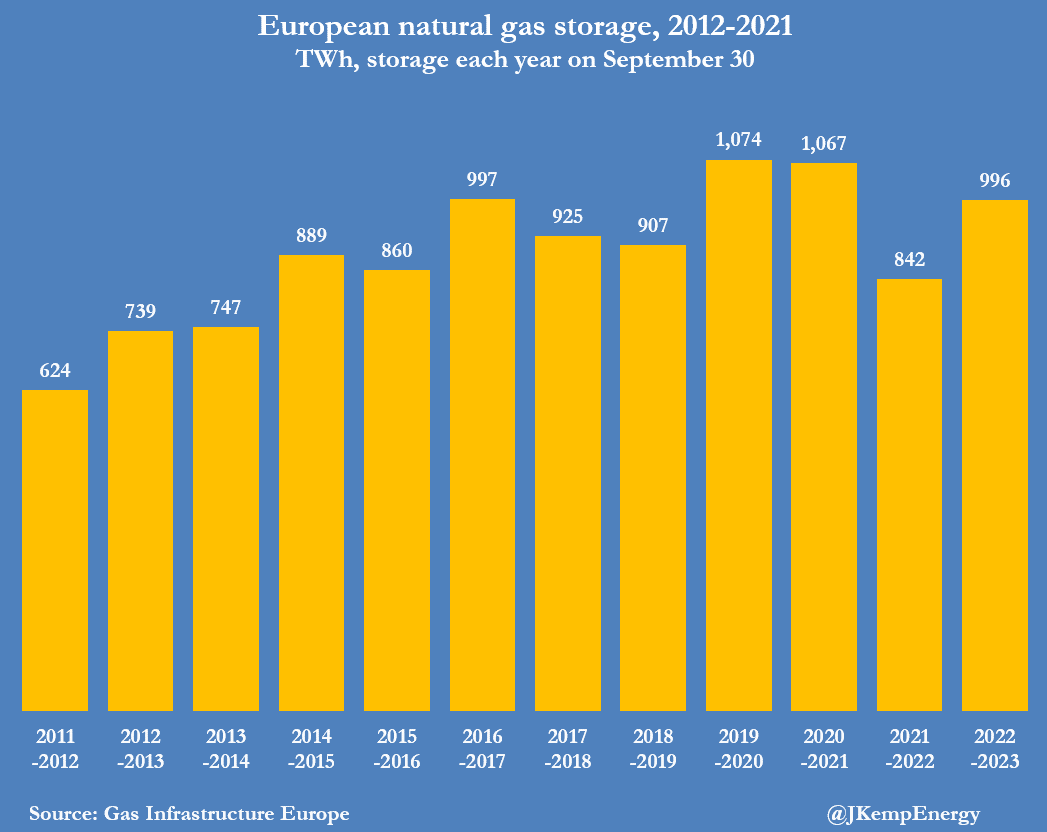
Gas inventories in the European Union and the United Kingdom were 996 terawatt-hours (TWh) by Sept. 30, according to data from Gas Infrastructure Europe (GIE).
For the time of year, inventories were at the third highest on record, with higher volumes of 1,074 TWh in 2019/2020, and 1,067 TWh in 2020/2021.
.

.
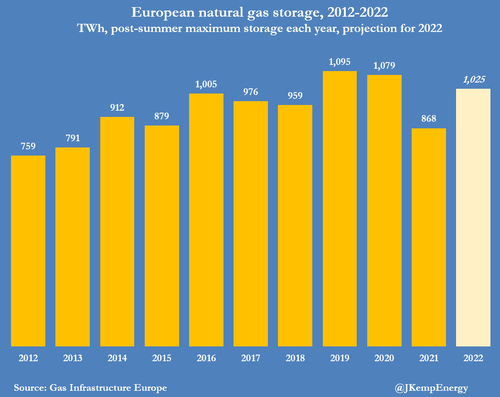
As Kemp forecasts, Inventories are likely to continue increasing for at least another three weeks until late October, but the build could persist into early November, depending on temperatures and how much high prices restrain consumption.
Since 2011, the median date on which storage peaked was Oct. 26, but in two cases inventories continued increasing into the first half of November.
Based on previous seasonal movements, storage is expected to peak around 1,025 TWh, with a likely range from 1,009 TWh to 1,053 TWh.
.
.
Is there enough gas in storage?
EU storage capacity is more than 89% full, and UK storage capacity is more than 94% full, with extra stocks likely to be added over the next 3-6 weeks.
Storage is well ahead of the formal target of 80% this year (preferably 85%) by Nov. 1, agreed by the EU in June (“Council adopts regulation on gas storage”, European Council, June 27).
According to Kemp, European governments have fulfilled their stated objective of maximizing the volume of gas in storage ahead of winter 2022/23
But storage is intended to deal with seasonal variations in consumption, not provide a strategic reserve in case of an embargo, or a blockade, or a rogue nation blowing up Nordstream-1 and Nordstream-2 pipe lines.
Maximizing the volume of stored gas will alleviate the impact of any supply disruptions, but it is not enough to guarantee supply security.
In the event of a complete cessation of imports from Russia, a colder than normal winter, such as the one forecast, or both, gas would become scarce before the end of March 2023.
Even if Europe scrapes through this winter, inventories are likely to end at very low levels, requiring another, perhaps even bigger, restocking next year ahead of winter 2023/24. And where would THAT additional gas come from?
Bottom line
Inventory accumulation has put Europe in a stronger position, than at this time last year, however last year had normal deliveries from Russia
STORAGE WOULD NEED TO BE MUCH GREATER THAN NORMAL TO COVER THE WINTER OF 2023/2024, WITHOUT NORMAL DELIVERIES FROM RUSSIA.
Regional supplies from outside Europe are highly uncertain, which will require further actions from:
1) Markets, such as reducing consumption and energy efficiency and partially shutting down high-energy consuming industries, and
2) Policymakers, such as raising interest rates to induce a multi-year recession to reduce demand, production and imports
And if Europe has a truly cold winter, then all bets are off...
LNG Exports to Enhance US Geo-Political Dominance, i.e., use it as a weapon
About 2000-2005, US think tanks proposed to convert a part of the abundant US gas reserves to liquid natural gas, LNG, and use the LNG to force Russian gas out of Europe and out of East Asia.
Around 2010, LNG facilities were being designed and erected mostly in Louisiana and Texas
In 2014, there was a color revolution in Ukraine, financed by the US, reluctantly supported by the EU
US exports of LNG were started in 2016
In 2018, Trump urged Germany not to be dependent on Russian pipeline gas;
He advised Germany to buy more expensive LNG from the US; Germans laughed at Trump.
The US capacity to produce LNG (13.8 bcf/d, June 2022) and exports of LNG were steadily increased.
Plans are to expand LNG production capacity to about 51.8 bcf/d, which would significantly increase all prices in the US, and make the US less competitive in world markets. See URL
Average level of exports was 11.2 bcf/d, during the first half of 2022
LNG exports likely will be 12.5 bcf/d, based on existing projects under construction, by end 2026
US fracked gas production was almost 80 bcf/d, in June 2022
Fracked gas production would have to significantly increase to support LNG exports of 45 to 50 bcf/d
https://www.lngindustry.com/liquid-natural-gas/29072022/eia-us-beco...
https://lngallies.com/charts/

.
NEW ENGLAND
By the way, all of this, including rolling blackouts at ZUB-ZERO temperatures, and a lack of gas and oil for space heating, applies to New England, if:
1) New York State keeps obstructing new gas pipelines from Pennsylvania to New England; THIS SHOULD BE LEGALLY FORBIDDEN AS AN UNCONSTITUTIONAL INTERFERENCE OF INTER-STATE COMMERCE, and
2) The New England oil, gas and coal storage capacities near power plants are not increased by at least 100% to ensure RELIABLE ELECTRICAL SERVICE IN WINTER, WHICH WOULD BE ESPECIALLY IMPORTANT, IF UNCERTAIN, MOTHER-NATURE, WEATHER-DEPENDENT WIND AND SOLAR WERE FURTHER EXPANDED, AS THE US AIMS TO BLINDLY COPY THAT DISASTROUS EUROPEAN SCENARIO
These articles and image are provided for reference.
.
ISO-NE REPORT OF 2021 ECONOMIC STUDY: FUTURE GRID RELIABILITY STUDY PHASE 1
https://www.iso-ne.com/static-assets/documents/2022/07/2021_economi...
DEEP DIVE SUMMARY OF THE ISO-NE REPORT
https://www.utilitydive.com/news/new-england-future-grid-study-iso/...
LIFE WITHOUT OIL
Life without oil means many products that are made with oil, such as the hundreds listed below, would need to be provided by wind and solar and hydro.
Those folks, including Biden, wanting to get rid of fossil fuels, such as crude oil, better start doing some rethinking.

APPENDIX 1
These articles contain significant information regarding wind, solar and grid-scale battery systems
GRID-SCALE BATTERY SYSTEMS IN NEW ENGLAND TO COUNTERACT SHORTFALL OF ONE-DAY WIND/SOLAR LULL
https://www.windtaskforce.org/profiles/blogs/grid-scale-battery-sys...
COLD WEATHER OPERATION IN NEW ENGLAND DECEMBER 24, 2017 TO JANUARY 8, 2018
https://www.windtaskforce.org/profiles/blogs/cold-weather-operation...
ANALYSIS OF WIND AND SOLAR ENERGY LULLS AND ENERGY STORAGE IN GERMANY
https://www.windtaskforce.org/profiles/blogs/wind-and-solar-energy-...
IRELAND FUEL AND CO2 REDUCTIONS DUE TO WIND ENERGY LESS THAN CLAIMED
https://www.windtaskforce.org/profiles/blogs/fuel-and-co2-reduction...
BATTERY SYSTEM CAPITAL COSTS, OPERATING COSTS, ENERGY LOSSES, AND AGING
https://www.windtaskforce.org/profiles/blogs/battery-system-capital...
HIGH COSTS OF WIND, SOLAR, AND BATTERY SYSTEMS IN US NORTHEAST
https://www.windtaskforce.org/profiles/blogs/high-costs-of-wind-sol...
APPENDIX 2
These articles explain a lot about the world-wide “Climate Crisis” scam, based on highly compromised surface station measurements, which typically read HIGH.
Climate scientists SUBJECTIVELY adjust the readings for use in their SUBJECTIVE computerized-temperature-calculation programs, which are used in the reports of IPCC, etc., for scare-mongering purposes.
New Surface Stations Report Released – It’s ‘worse than we thought’
https://www.windtaskforce.org/profiles/blogs/new-surface-stations-r...
Weather- Just how does it happen?
https://www.windtaskforce.org/profiles/blogs/weather-just-how-does-...
A summary of the results of three “Physics of the Earth’s Atmosphere” papers, which were submitted for peer review at the Open Peer Review Journal.
https://globalwarmingsolved.com/2013/11/19/summary-the-physics-of-t...
APPENDIX 3
Satellites and balloons measure temperatures of the Troposphere, which starts at ground level, and has an average height of 59,000 ft at the tropics, 56,000 ft at the middle latitudes, and 20,000 ft at the poles. Above those levels starts the Stratosphere.
Balloons directly measure temperatures. Satellites measure radiation, from which temperatures are calculated.
Both consistently measure much lower temperatures than the average of 102 computer-generated graphs.
See Appendix 2 and 3
The data in the below images is for a 43-y period.
There is global warming, but it is not anywhere near as much as scare-mongers are claiming.
https://www.windtaskforce.org/profiles/blogs/grid-scale-battery-sys...
1) Objective satellite and balloon temperatures increased from 0.00 to 0.5 C, or, or 0.116 C/decade
2) Subjective computer-generated temperatures increased from 0.00 to 1.20 C; or 0.28 C/decade, about 2.7 TIMES AS FAST
The temperature data by satellites and balloons are more accurate than land-based measurements.
See Appendix 2 and URL
https://en.wikipedia.org/wiki/UAH_satellite_temperature_dataset
Satellite measurements are made many times during every day and systematically cover almost the entire world; +/- 85-degree latitude.
The satellite data is vastly more complete, and accurate than would be gathered by ground stations. (See Appendix 2)
Balloon measurements, made on a sampling basis, are vastly less complete than satellite measurements, but they serve as a useful crosscheck on the satellite measurements.
NOTE: Behind the 102 computer graphs are hundreds of organizations that likely receive a significant part of their revenues from governments and subsidy-receiving wind, solar, battery, etc., businesses.
The livelihood and career prospects of the people creating these graphs is more secure, if they aim high, rather than low.
https://www.scienceunderattack.com/blog/2021/2/22/latest-computer-c...

A more detailed view of satellite temperatures.

APPENDIX 4
Science and Environmental Policy Project (SEPP) and also a member of the CO2 Coalition. Sheahen and the Coalition are collaborating on a brief.
SEPP’s October 8 newsletter contains a summary of a major 2021 paper by Happer and co-author William van Wijngaarden that completely undermines the fake “science” the IPCC and EPA used to support the case of climate alarm. See URL
https://wvanwijngaarden.info.yorku.ca/files/2021/03/WPotency.pdf?x4...
Sheahen specifically discusses the efforts of Professors William van Wijngaarden and William Happer in their pioneering work in calculating the real-world Global Warming Potentials (GWPs) of the five most common Green-House Gases (GHGs).
Sheahan explains why the approach used by IPCC is faulty, but nonetheless used by its followers, such as the US National Center for Atmospheric Research (NCAR) and the EPA.
These faulty methods lead to great exaggeration of the greenhouse effect of carbon dioxide, methane, and other minor greenhouse gases.
Sheahan shows the stunning agreement between the calculations of van Wijngaarden and Happer (W & H) with satellite measurements (and balloon measurements) of outgoing infrared radiation emitted by the earth to space . . .
Sheahan claims, because of the exceptionally good agreement between observational data and the calculations of W & H, we can conclude the W&H model has been validated.
The W&H model embodies the scientific method, i.e., it is reasonable to use it to study other hypothetical cases.
It is not possible to do so with IPCC models, which have never achieved agreement with observations.
See Appendix 3
The gist of the H&W work is the greenhouse effect of CO2 in the atmosphere is almost entirely saturated, such that any additional CO2 can have almost no additional warming effect.
Here is a chart prepared by Sheahan to illustrate the H&W results.
As atmospheric CO2 increases, say from 380 to 420 ppm; the 40 ppm increase has about 0.05C warming effect.
As atmospheric CO2 increases, say from 20 to 60 ppm; the 40 ppm increase has about a 0.5C warming effect.


You need to be a member of Citizens' Task Force on Wind Power - Maine to add comments!
Join Citizens' Task Force on Wind Power - Maine