.
The Greenhouse Model and CO2 Contribution
The Greenhouse Model and CO2 Contribution
https://www.windtaskforce.org/profiles/blogs/the-greenhouse-model-a...
https://www.linkedin.com/pulse/greenhouse-model-co2-cyril-huijsmans
Dr. Cyril Huijsmans, a Dutch Research Scientist Retired from Shell
.
The Greenhouse model, as is universally presented, appears to be incorrect.
Molecular collisions and convection, rather than re-radiation back to earth, is the energy transfer mechanism.
The black body radiation of the earth, after absorption by greenhouse gases, is quickly converted into kinetic energy, and becomes part of the thermal pool of the atmosphere.
The atmosphere should not be treated as a black body, BB, radiator, as there is no thermodynamic equilibrium. Even for a local thermodynamic equilibrium, one cannot define its boundaries in the sense of the premises of Planck's law.
Furthermore, the maximum possible contribution of CO2 to the greenhouse warming is limited to about 7% of the total warming potential from BB radiation.
This is based on only the black body energy availability from Planck's energy distribution in the range of the CO2 absorption wavelengths.
To achieve this maximum possible contribution, about 0.15% of the current presence of CO2 molecules in the atmosphere would participate, i.e., less than 1 ppm of CO2 concentration in the atmosphere.
Water vapor, WV, is the most important greenhouse gas and contributes about 93% of the greenhouse warming. With the current concentrations of WV and CO2, the black body energy is fully absorbed, i.e., saturated.
.
NOTE: These articles have similar results using WV and CO2 ppm in atmosphere.
https://www.windtaskforce.org/profiles/blogs/hunga-tonga-volcanic-e...
https://www.windtaskforce.org/profiles/blogs/natural-forces-cause-p...
.
1 Introduction
.
CO2 is considered by the IPCC and allied entities, as the main contributor of the greenhouse phenomenon.
To place this view in perspective, it is important to realize, the earth’s BB, radiation is the source of heat trapped by the greenhouse effect.
.
The model of the greenhouse phenomenon considers absorption of the earth’s BB radiation by greenhouse gases.
Subsequently, the greenhouse gases radiate the absorbed energy back to earth, keeping the soil warm and by convection/collisions also keeping the atmosphere warm.
The most important greenhouse gases are WV and CO2.
There are more greenhouse gases, but their contribution is very small.
.
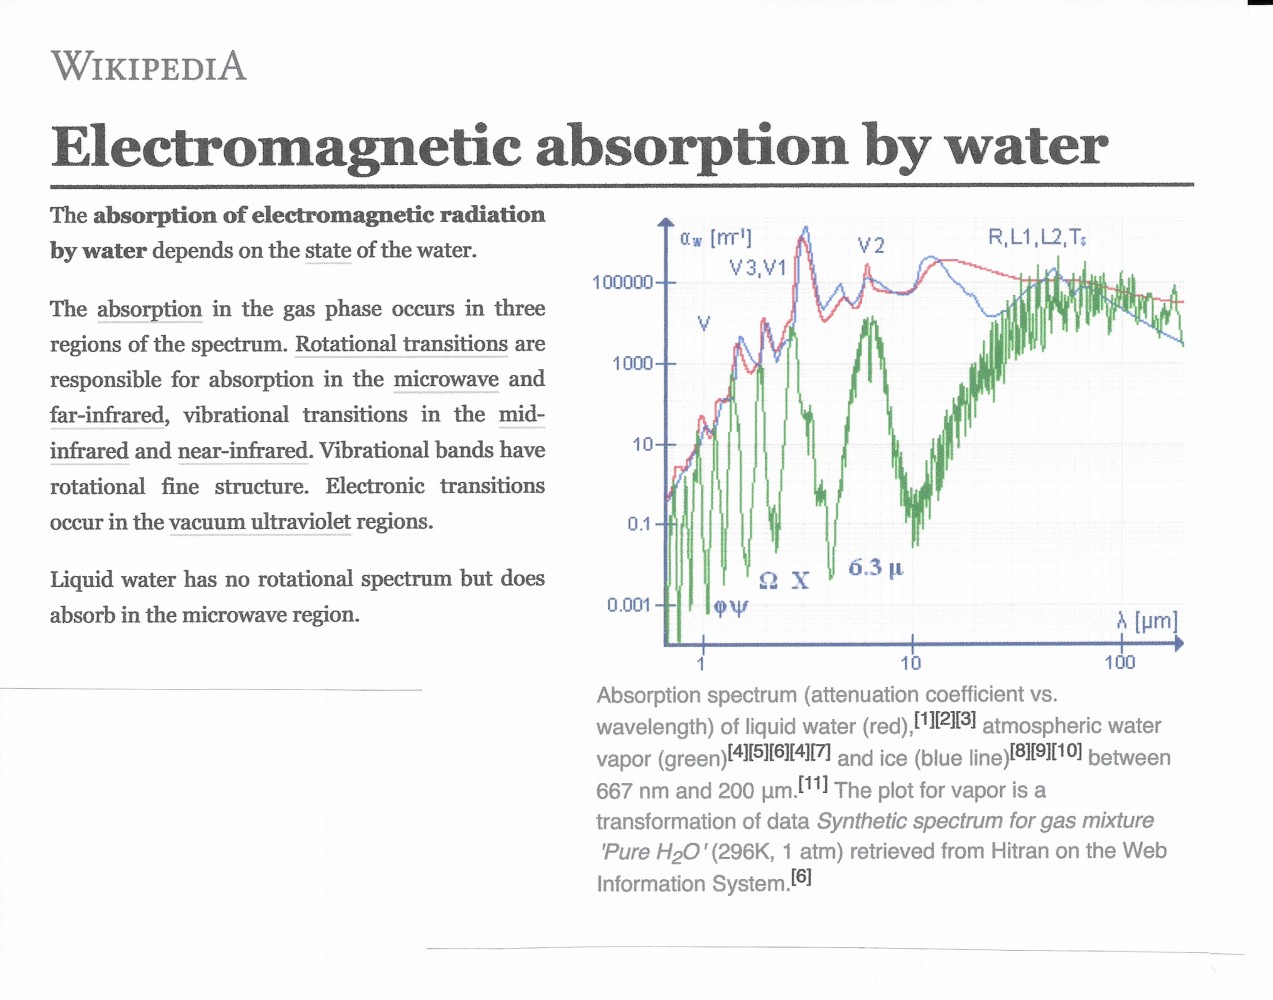
The earth’s BB radiation ranges between wavelengths 2 - 70 micrometer.
WV is the most important and dominant greenhouse gas, which absorbs heat in the whole range of wavelengths of the earth’s BB radiation, except between 8 - 12 micrometer, and to a lesser extent around 15 micrometer.
CO2 absorbs essentially only one at wavelength, i.e., 15 micrometer.
There are two more wavelength's of absorption by CO2, but they are at the edge of the earth's BB radiation curve, and their contribution is very small, i.e., less than 0.5%.
The atmosphere of the earth is transparent to space between 8 - 12 micrometer; WV and CO2 are not absorbing at these frequencies.
A part of the IR radiation between 8 - 12 micrometer returns directly into space.
The greenhouse effect, due to CO2 absorbing the earth's BB radiation, mostly at about 15 micrometer, is about 10.5%
This is the part of the earth's BB radiation, emitted at 300 K, that can be absorbed by CO2, as calculated with Planck’s law. See Appendix A
However, the 10.5% gets reduced to about 7%, due to 1) the overlap of the WV and CO2 absorption spectra at about 15 micrometer, and 2) the 20000/423 = 47 times greater abundance of VW molecules vs CO2 molecules, near the surface, where almost all absorption takes place.
The rest of the greenhouse effect, due to WV, is about 93% See Appendix C.6
.
2 Greenhouse Model
.
2.1 Radiative transfer of heat in the atmosphere
.
In principle, every object radiates heat depending on its temperature and also its resemblance to a black body, and so does the earth.
One might think, the atmosphere also radiates energy depending on its temperature.
Some articles and climate models assume, such radiation has an energy density field as described by Planck's law.
However, the atmosphere is not even close to the concept of a black body.
It is an essentially open system without a boundary in the sense of the definition of a boundary of a black body.
The notion of a volume in which standing lightwaves in a very wide range of frequencies, with photons, which are formed and annihilated at its boundaries to come to thermodynamic equilibrium with a "Planckian" distribution, thereby adopting the temperature of the boundary is hard to envisage.
The atmosphere is not in thermodynamic equilibrium.
Locally there can be a sort of equilibrium, but its boundaries are ill defined.
It is a notional concept of LTE, but it is not consistent with the premises of Planck's law.
Where is the physical evidence?
The greenhouse gases, including WV, only have a limited range of frequencies in which they can absorb or emit.
At 15 micrometer, radiation can only come from the radiation of the earth or from thermal excitation by air molecules.
Nitrogen, Oxygen and Argon, which are 99.9% of dry air, do not participate in a radiative sense, but only by means of conduction, such as molecular collisions.
.
Assuming a local thermodynamic equilibrium, the Boltzmann distribution, at an average earth temperature of 288 K (15 C) determines, for the 15 micrometer transition, about 3.6% of CO2 molecules in air would be in the excited state. De-excitation can take place via radiation and by molecular collisions.
In case of molecular collisions, radiation of longer wavelengths may also result.
The excitation energy can be fully converted into kinetic energy, or partly converted into kinetic energy with emission of a new photon with a longer wavelength.
The presence of WV allows re-absorption of these longer wavelengths.
The nature of excitation of CO2 and WV molecules is kinetic rather than by excitation of electrons, i.e., the stretching, bending and rotation of the molecules.
.
The molecular density of CO2 at sea level, at 288 K (15 C), is 1.012 x 10^22 molecules/m3. See C.7.1
Thus, the number of CO2 molecules in the excited state of 15 micrometer is 0.036 x (1.012 x 10^22) = 3.64 x 10^20 molecules/m3.
If one assumes, de-excitation takes place only by radiation, the radiation energy would be (the number of transitions per second) x (the transition energy at the 15 micrometer wavelength of 1.325 x 10^-20 joule) See C.7.1
The Einstein A coefficient for spontaneous emission is around 1 per second (Hitran data base).
Assuming this is a "steady state" with 3.6% of CO2 molecules excited, the total energy emitted per second is 4.823 W/m3
As the energy goes equally in all directions, the energy flowing out of a 1 m3 sphere per unit area of the sphere, is 1 W/m2.
The Planck spectral radiance at 288K, at 15 micrometer (line width 2 micrometer) is 36.5 W/m2.
Thus 1 m3 of air would radiate 1/36.5 = 0.0274, i.e., 2.74% of the earth’s BB radiation.
However, the power emitted from a volume is proportional with the volume, whereas, the energy flux per m2 is proportional to the surface area of the sphere.
Therefore, the energy flux (W/m2) would be proportional with the radius of the sphere.
A sphere of air with a radius of 24 m would equal the earth’s BB radiation at 36.5 W/m2 (288 K)
The sphere would also receive radiation from its surroundings. Under above assumptions, such radiation could be absorbed, or cause stimulated emission, or intensify the "thermal" radiation field.
In case of absorption, the excited state would become overpopulated relative to the assumed thermodynamic equilibrium at 288K, leading to intensified emission.
.
At the top of the troposphere, at 10 km, the prevailing temperature is about 223 K (-50 C) and the density is about 0.327 kg/m3. See Appendix C.3
At that altitude, still about 1.27% of the CO2 molecules would be in the exited state under local thermodynamic equilibrium and the Boltzmann distribution, due to the lower density of the air, whereas CO2 would be about 400 ppm, CO2 molecules per m3 would be less.
A sphere of air with a radius of 234 m would equal the earth’s BB radiation at 36.5 W/m^2 (288 K).
As such, the radiation potential from thermal excitation is far greater than the earth’s BB radiation.
.
Molecular collisions are in the order of 4 billion per second per molecule, at a pressure of 1 bar and a temperature of 288 K. See C.4 and C.5
.
Considering the Maxwell-Boltzmann distribution of molecular velocities, at least 10% of the collisions can potentially excite the 15 micrometer band.
Taking into account the geometrical distribution of velocities being homogeneous in all directions, a small fraction between 10^-4 and 10^-3 of these potential collisions will actually excite.
Nevertheless, the exciting collision rates are still in the order of 10,000 to 100,000 per second per molecule. Even at an altitude of 10 km, the molecular collisions which excite are at least between a 1,000 and 10,000 per second per molecule.
The rate of spontaneous de-excitation, or emission, is determined by the Einstein A coefficient, which is around 1 per second.
The probability of de-excitation without radiation, or with a lower frequency of radiation by molecular collisions, is orders of magnitude larger than de-excitation by radiation.
.
Hence, molecular collisions completely dominate the local thermal equilibrium, even up to altitudes beyond 10 km. Heat transfer is by convection rather than radiation.
The assumption of de-excitation only by radiation means, the atmosphere would strongly radiate into space. Such radiation has not been observed by satellites.
The satellite observations tell us, the earth atmosphere is essentially opaque for the wavelengths of the greenhouse gases with 100% absorption. Therefore, the concept of re-radiation is not tenable.
Due to the dominance of molecular collisions, the earth atmosphere is opaque in the range of wavelengths of the greenhouse gases.
At higher altitudes, well above 10 km, radiation becomes dominant over molecular collisions, due to the lower density.
.
The Einstein A coefficient for spontaneous emission is around 1 - 5 per second.
This holds for a rather wide span of wavelengths, also covering the P and R branches of the CO2 absorption spectrum (HITRAN data base).
The Einstein A coefficients are linked to the Einstein B coefficients, as well as the absorption cross sections in "Lambert-Beer" and oscillator strengths (another expression for probability of absorption).
As such, the Einstein A coefficients are a measure for the intrinsic probability of absorption by molecules.
With similar A coefficients and similar energy densities of the radiation field, one would expect similar extinction (or saturation) distances.
The P and R branches are not independent from the Q branch which is the main transition relevant for the greenhouse effect.
The P and R states are substates (de-generation) of the Q transitions.
The rotational energies are some 10% of the Q ( bending mode ) transitions.
If they could be excited independent of the 15 micrometer vibration, about 80% of the P and R branch energy levels would be saturated (Boltzmann).
This means, when the Q branch is extinct (saturated), so are the P and R branches.
.
2.2 Theoretical expectation of absorption
.
In thermodynamic equilibrium, the rate of absorption (and the rate of induced emission) by CO2, at the 15 micrometer transition, is a factor 27 times smaller than the Einstein A coefficient (1 per second)
The emission rate of photons, at 15 micrometer, and a band width of 2 micrometer, is 32 × 10^20 per second per m2.
With an absorption coefficient of 0.0371 per second, and 1.012 × 10^22 CO2 molecules per m3 at sea level, the extinction distance is 8.5 m.
Induced emission extends the extinction distance by about the same amount, provided the molecules are in an excited state.
Due to molecular collisions, the effect of induced emission is small.
The absorption measurement of Dr. Heinz Hug (1) gave an extinction distance of about 10 m.
The assumption of the presence of a "Planck" energy density field is questionable.
However, a photon carries its own energy density field.
The Einstein coefficients are molecular properties independent of the energy field, or if there is thermodynamic equilibrium.
As such, the experiment of Hug may also quantify the energy density of the 15 micrometer photon.
.
2.3 Timescale of "back-radiation"
.
There appears to be consensus, full absorption of the earth’s BB radiation takes place within very short distances, i.e. order of meters.
This means, full absorption takes place in fractions of a microsecond.
This notion of short absorption distances is largely based on the assumption of an energy density in accordance with the Planck law, and the Einstein B12 coefficient for absorption with a concentration of CO2 molecules of 10^22 per m3.
With an abundance of CO2 molecules over photons, even with the low absorption coefficient, absorption can take place at a short distance.
Alternatively, in absence of Planck's energy density, each photon would carry its own energy density, which at a value of 0.2 J.m^-4 (See section 3.3) comes close to the value of Planck.
The implication is, de-excitation also must take place in a very short timeframe, as otherwise the CO2 molecules would remain in the excited state and become transparent. The absorption distance would be much larger.
With reference to section 2.1, there would be an overpopulation of excited CO2 molecules and full absorption could not take place within the short distance and timeframe.
As the frequency of collisions between the CO2 molecules (and also WV molecules) and the molecules of the air in which the absorbed energy is dissipated to the air, is orders of magnitude faster (See Appendix C.4 and C.5), de-excitation by collisions, essentially without 15 micrometer photon emission, is predominant over back-radiation.
Only a very small fraction of the blackbody radiation is radiated back, per the adopted green house model.
As such, the earth’s BB radiation is quickly thermalized and becomes part of the atmospheric heat content.
.
3 Experimental confirmation
.
3.1 The experimental confirmation of this model can be found in the results of absorption measurements by Dr. Heinz Hug (1).
Hug carried out absorption measurements of IR at 15 micrometer in a mixture of 375 ppm CO2, 2.6% (26000 ppm) WV, and air.
Hug calculated, based on his measurements, a total absorption distance of about 10 meter.
With the speed of light, the time for total absorption is 0.033 microsecond.
Hug recognized the possible dominance of kinetic transfer of energy in his paper, in which he also refers to Mr Jack Barrett (2) who had similar considerations.
.
4 Greenhouse Role of CO2 in Atmosphere
4.1 Adopting a timeframe of 0.033 microsecond, the number of photons emitted by the earth’s BB radiation, at 15 micrometer, is according to Planck’s law, about 1.0556 x 10^10 per cm2
This is based on radiation into the full hemisphere, and a line width of 2 micrometer. See C.6 and C.7.1
Based on an absorption distance of 10 m, and the law of Avogadro, the number of CO2 molecules in a column of air of 1 cm2 and 10 m high is 1 x 10^19
Thus, for full absorption, 1 x 10^19/1.0556 x 10^10 = 1 x 10^9 molecules per photon would be needed.
The concentration of CO2 up to a height of 80 km is fairly constant.
The number of CO2 molecules in a column of air of 1 cm2 extending to space (say 80 km) is 8.28 x 10^21 at a concentration of 400 ppm.
This means, only 0.12% of the CO2 molecules present in the atmosphere are needed to obtain full absorption. See C.7.1
.
4.2 Despite the low transition rates for absorption and spontaneous emission, the absorption of the earth’s BB radiation is at a short distance.
The ratio of CO2 (and also WV) molecules over emitted photons is very large and therefore, saturation (read full extinction) of the earth’s BB radiation takes place in the order of tens of meters.
In the absence of a "Planckian" radiation field, a single photon carries its own energy density field.
Calculating back from Hug's experiment, the ratio of molecules over photons to achieve extinction is 1 x 10^9 molecules per photon. The time to extinction is 0.033 microsecond.
The Einstein equation for absorption, with the Einstein coefficient B12 = 0.152 m4/J.sec (See C.5.3), dn = 1 and dt = 0.033 x 10^-6 sec , transition rates of 0.03/sec, and a photon energy density field of 0.2 J.m^-4, would result, which is 80% of the Planck value.
The "volume" of a photon energy quantum, or energy package is 6.75 x 10^-13 m3k
.
4A Greenhouse Role of WV in the atmosphere
.
4A.1 WV is the most abundant greenhouse gas in the atmosphere. Moreover its absorption spectrum covers, almost as a continuum, the full spectrum of the earth’s BB radiation (4), with the exceptions mentioned above (4 - 12 micrometer and around 15 micrometer).
Similar to CO2, the radiative lifetime for spontaneous emission is relatively long, albeit, in certain spectral ranges, faster than CO2. The shortest radiation lifetimes are in the order of 0.005 second (HITRAN data base).
This means, also for H2O, the kinetic processes, such as collisions, near sea level, are much faster than spontaneous emission to dissipate excitation energy.
HITRAN (3) gives extinction distances (reduction in intensity by factor, 1/e ) of IR in a range from 15 to 100 micrometer, in 100% WV, between 0.1 and 0.0001 meter.
At a world average concentration of WV of 0.4% (4000 ppm), actual extinction distances could range between 25 and 0.025 meter, i.e., almost total extinction between 150 and 0.15 meter.
Therefore, the timescale of almost total extinction is between 0.5 microsecond and 0.5 x 10^-9 second. See C.4 and C.7.2
.
4A.2 With the timeframe of 0.5 microsecond, the ratio of WV molecules at 4000 ppm over the full spectrum of photons of the earth’s BB radiation is about is 8.5 x 10^8 molecule/photon. (Avogadro and Stefan-Boltzmann T^4 law).
This is based on a full hemisphere of emitted photons in a column of air of 1 cm2 and 150 m high to extinction.
The presence of WV becomes near zero at about 10 km height. The average concentration in the troposphere is about 4000 ppm.
The total presence of WV is about 32 times of what is needed for total extinction.
This means, only 3% of the WV molecules present in the atmosphere are needed to obtain full absorption
See C.7.2
.
5 Satellite observations
.
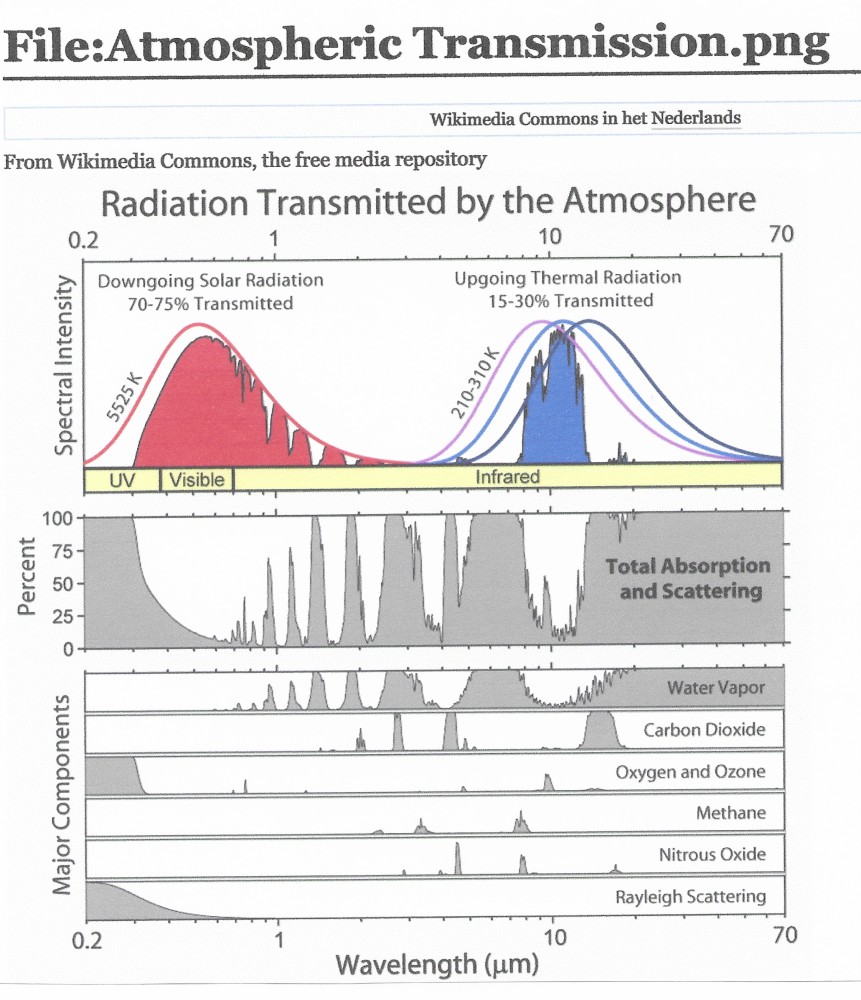
The total extinction of the BB radiation of the earth is confirmed by various references, such as “ Atmospheric Transmission “ (4) and X-ray astronomy (5).
.
7 CONCLUSION
.
The model of the greenhouse effect, as is generally presented, appears to be incorrect.
Molecular collisions and convection, rather than back-radiation, dominates the energy transfer of the earth's BB radiation.
Only at high altitudes greater than 10 km, radiation becomes dominant depending on the altitude.
Only a small fraction of CO2 and H2O present in the atmosphere is needed for full absorption of the earth's BB radiation.
.
8 References
.
(1) The Climate Catastrophe Dr. Heinz Hug: https://www.john-daly.com//artifact.htm
(2) Jack Barrett, Spectrochim. Acta Part a, 51, 415 (1995)
(3) Electromagnetic Absorption by water:
https://en.wikipedia.org./wiki/Electromagnetic_absorption_by_water.
“Hitran on the Web Information System” Harvard-Smithsonian Center for Astrophysics(CFA), Cambridge, MA, USA
V.E.Zuev Institute of Atmospheric Optics (IAO), Tomsk, Russia. Retrieved August 11, 2012
(4) Atmospheric Transmission : https://commons.wikimedia.org/wiki/File
Atmospheric_transmission.png
(5) X-Ray astronomy, https://en.wikipedia.org/wiki/X-ray_astronomy
.
APPENDIX A : Planck's curve at 300 K
.
.
Planck's radiation curves at 6000, 1500, 300 K.
The spectral radiance is 10^-5 W/m2 sr at 6000 K (the peak is in the visible wavelengths), and 10 ^-12 W/m2 sr at 300 K, the peak is at 10 micrometer. Red and blue curve
WV (about 20,000 ppm near the surface) and CO2 (about 423 ppm at end 2023) are strong photon absorbers at about 15 micrometer
Visible wavelengths have 10^-5/10^12 = 10^7 times more W/m2 than IR wavelengths at 10 micrometer
https://pubsapp.acs.org/subscribe/archive/ci/31/i02/html/02learning....
.
APPENDIX B : Electromagnetic absorption by water and Atmospheric transmission
.
.
.
APPENDIX C: CALCULATIONS
.
C.1, Number of molecules of air in a column of air of 1 cm^2 into space (1 bar):
Weight 1000 gr
Mol wgt. = 29
Constant of Avogadro: 6 x 10^23 per mol
Thus: (1000/29) x (6 x 10^23) = 2.07 x 10^25 molecules of air.
.
The number of molecules CO2 at 400 ppm, and assuming a constant concentration into upper space, is 8.28 x 10^21.
Up till about 80 km height, the concentration of CO2 in air is about constant.
As the density of air above 70 km is less than 60 x 10^-6 kg/m3, the above number of CO2 molecules is about correct.
.
C.2, Barometric formula:
P(h)/P0 = exp (-Mgh/RT) C.2.1
g = 10 m/s^2
R = the gas constant 8.3145 J/mol.K
T = temperature, K
Air density ρ = PM/RT C.2.2
.
C.3, Air pressure and density:
At sea level :
If T = 273 K, P = 1.0189 x 10^5 Pa: ρ = 1.0189 x 10^5 x 0.029/(8.3145 x 273) = 1.294 kg/m3
If T = 288 K, ρ = 1.223 kg/m3
.
At 1 km, T = 281.5 K, P = 78740 Pa, ρ = 0.9756 kg/m3
At 5 km, T = 256 K, P = 50600 Pa, ρ = 0.6894 κg/m3
At 10 km, T = 223 K, P = 20930 Pa, ρ = 0.327 kg/m3
At 50 km, T = 273 K, P = 168 Pa, ρ = 0.00215 kg/m3
At 70 km, T = 215 K, P= 1.17 Pa, ρ = 0.000019 kg/m3
At 100 km, T = 183 K, P = 5.3 x 10^-4 Pa, ρ = 1 x 10^-8 kg/m3
.
C.4, Molecular collisions in air:
Formula for mean free path: L = 1/ n x π x d^2 C.4.1
L = mean free path, m
n = particle (molecular) density, m^3
π = 3.14
d = molecular kinetic diameter 300 x 10^-12 m (N2 = 364 ppm, O2 = 346 pm), i.e., conservative.
Average relative velocity of molecules: sqrt2 x V
V is the average molecular velocity, m/s
Average time between collisions: T = L/(sqrt2 x V) C.4.2
.
The Maxwell-Boltzmann distribution gives for the average velocity: Va = sqrt(8kT/(π M)) C.4.3
k is the constant of Boltzmann 1.38 x 10^-23 J/K, and M is the molecular mass in kg.
.
The molecular mass of N2 is 4.667 x 10^-26 kg
For N2, at 300 K, the average velocity Va = 475 m/s.
The most probable velocity is always lower. It is given by the formula Vp = sqrt(2kT/M) C.4.4
For N2, at 300 K, this velocity Vp = 421 m/s. In the subsequent calculations, Vp is used.
.
Frequency of collisions in air:
.
At sea level: pressure 10^5 Pa and temperature 293 K, ρ = 1.2057 kg/m3. Particle density n = (1.2057/29) x 6 x 10^26 = 2.494 x 10^25/m3
molecular velocity Vp = 421m/s,
Thus the time between collisions is: T = 1/(421 x 2.494 x 10^25 x 3.14 x 300x 300 x 10^-24 x sqrt2) = 1/(4.1963 x 10^9) = 0.238 x 10^-9 second
Therefore, the number of collisions is about 4 x 10^9 per second (4 billion/second)
.
At 10 km height: pressure 20930 Pa and temperature 233 K, ρ = 0.313 kg/m3. Particle density n = (0.313/29) x 6 x 10^26 = 6.476 x 10^24/m3
molecular velocity Vp = 370 m/s
Thus, time between collisions is: T = 1/(370 x 6.476 x 10^24 x 3.14 x 300 x 300 x 10^-24 x sqrt2) = 1/(0.958 x 10^9) = 1.0410^-9 second
Therefore, the number of collisions is about 10^9 per second (1 billion/second).
At 223 K and ρ = 0.327 kg/m3 the number of collisions is the same.
.
At 50 km height: pressure 168 Pa and temperature 273 K, ρ = 0.00215 kg/m3, particle density n = (0.00215/29) x 6 x 10^26 = 4.445 x 10^22, molecular velocity, Vp = 400 m/s,
Thus, time between collisions is : T = 1/(400 x 4.445 x 10^22 x 3.14 x 300 x 300x10^-24 x sqrt2) = 1/(7.106 x 10^6) = 1.41 x 10^-7 second
Therefore, the number of collisions is about 7.1 x 10^6 per second (7 million/second).
.
At 70 km height: pressure 1.17 Pa and temperature 215 K, ρ = 0.000019 kg/m3, particle density n = (0.000019/29) x 6 x 10^26 = 3.93 x 10^20/m3, molecular velocity Vp = 355 m,
Thus, time between collisions is: T = 1/(355 x 3.93 x 10^20*3.14 x 300 x 300x10^-24 x sqrt2) = 1/48097 = 20.8 x 10^-6 second
Therefore, the number of collisions is about 48,000 per second
.
In above calculations the velocities are based on N2. For the air mixture this would mean, the number of collisions are 1.5% lower.
.
C.5 Einstein coefficients.
.
The relationship between the Einstein coefficients for spontaneous emission A21, for absorption B12 and stimulated emission B21 are given by the following equations, which are based on the Planck energy density function in wavelength:
.
A21/B21= 8πhc/λ^5 C.5.1
Β21/Β12= g1/g2 C.5.2
.
where, h is the constant of Planck 6.626 x 10^-34, c the velocity of light in m/s, ν the frequency of radiation, and λ the wavelength in m.
g1 and g2 are the degeneration, or multiplicity, of the quantum states 1 and 2.
The ratio's of g1//g2 are about 1 for CO2 at 15 micrometer, and also for WV in a range of wavelengths.
At 15 micrometer the value of A21/B21 = 6.579 J.m^-4
Thus B21 = 0.152 x A21, and B12 = B21 x g2/g1. B12 equals approximately B21.
.
The dimension of the A coefficient ( s^-1) is different from the B coefficients ( J^-1.m^4.s^-1), as the B coefficients multiply with the Planck spectral energy density function to obtain transition rates.
.
HITRAN (3) gives for CO2 at 15 micrometer:
wavenumber 666.992, A21 = 0.9866/sec
wavenumber 667.032, A21 = 1.299 /sec
.
Therefore, the value of B12 = 0.152 J^-1.m^4.s^-1 C.5.3
.
C.6 Earth black body radiation
.
The earth emits radiation in accordance with Planck's law. Integration of Planck's law over frequency (or wavelength) and space angle yields Stefan-Boltzmann's law.
.
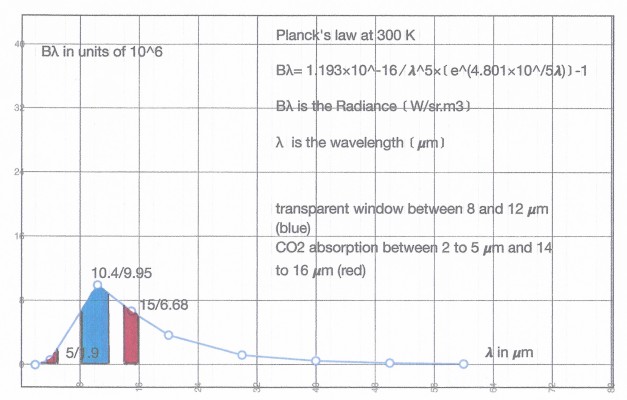
Planck's law in wavelength is: Bλ(λ,T)= (2hc^2/λ^5) x 1/((exp hc/λkT) - 1) C.6.1
.
where, Bλ is the spectral radiance, sr, of a body in watts per unit area, per unit wavelength, per unit solid angle with dimension (W/sr.m^3), and h is Planck's constant, c velocity of light, λ radiated wavelength, k Boltzmann's constant, T absolute temperature in K.
.
For 300 K, the formula reduces to: Bλ = (1.193 x 10^-16)/ λ^5 x 1/((exp(4.801 x 10^-5/λ)-1) C.6.2
.
The radiance curve is presented in Appendix B:
.
At the CO2 wavelength of 15 micrometer, the radiance value Bλ = 6.68 x 10^6 W/sr. m^3
With a line width of 2 micrometer, the emitted energy per cm2 becomes 0.00134 W/sr.cm2
Integration over the space angle applying Lamberts' cosine law to a hemisphere yields
E = 0.xn--00134x-u0e = 0.0042 W/cm2 C.6.3
.
There are two more wavelengths at which CO2 can absorb the earth's BB radiation, notably at 2.7 and 4.3 micrometer.
The energy in the interval of BB radiation at 300 K, between 2 and 5 micrometer is
B = 2 W/sr.m2, or 0.0002 W/sr.cm2, or E = 0.00063 W/cm2
Thus, the total energy emitted by the earth's BB radiation, in the wavelengths CO2 can absorb is
E = 0.00483 W/cm2 C.6.4
.
The total BB radiation follows from Stefan-Boltzmann's law : Et= σT^4 C.6.5
At 300 K, the total emitted BB energy is Et = (5.6704 x 10^-8) x 300^4 = 0.0459 W/cm2 C.6.6
.
Thus, the maximum potential absorption by CO2 at an earth temperature of 300 K, is about 10.5% of the total BB radiation.
At the current average temperature of the earth of 288 K (15 C), the contributions of the 2.7 and 4.3 wavelengths become very small, as the zero point of the Planck curve shifts by about 1 micrometer.
Therefore, at 288 K, the maximum share is about 9%
Because, there is a transparent window between 8 - 12 micrometer, the total amount of BB radiation to warm up the atmosphere is reduced by 0.0119 W/cm2
Thus, at 300 K, the relative contribution of CO2 to the greenhouse effect increases:
Total BB radiation minus loss in window is 0.0459 - 0.0119 = 0.034 W/cm2
Maximum CO2 potential 0.00483/0.034 = 0.142, i.e. 14.2%
However, taking into account the presence of WV, which at 15 micrometer wavelength, still has an attenuation distance of 1.23 m (reduced by factor 1/e), at a concentration in air of 0.4% volume (virtually total extinction in 7.5 m), only about 50% of the absorption in the 15 micrometer range is by CO2.
Thus, the maximum potential contribution by CO2 to the greenhouse warming 300 K is about 7%
.
C.7 Molecules, Photons, Total Extinction
https://www.windtaskforce.org/profiles/blogs/the-greenhouse-model-a...
C.7.1, CO2
.
Radiation, E, emitted by the earth at 15 micrometer wavelength, and line width of 2 micrometer, is 0.0042 W/cm2 C.6.3
Photon energy, per Planck is Ef = hc/λ C.7.1
Ef = (6.626 x 10^-34) x (3 x 10^8)/(15 x 10^-6) = 1.325 x 10^-20 joule
Photons emitted is 0.0042/(1.325 x 10^-20) = 3.17 x 10^17 per cm^2, per second.
At sea level, at 288 K, air density at 1.223 kg/m^3, CO2 at 400 ppm, CO2 molecules is 1.012 x 10^22 per m^3
.
The Dr. Heinz Hug (ref #1) experiment measured virtually total extinction within 10 m.
Time frame for absorption is 10/(3 x 10^8) = 3.333 x 10^-8 second, or 0.0333 microsecond.
In such a timeframe, emitted photons is 3.17 x 10^17 x 0.0333 x 10 ^-6 = 1.0556 x 10^10
In a column of air, 1 cm^2 and 10 m high, for extinction, CO2 at 400 ppm, CO2 molecules is 1 x 10^19
Ratio of CO2 molecules and photons for extinction is (1 x 10^19)/(1.0556 x 10^10) = 9.47 x 10^8 molecule/photon
.
In a column of air, 1 cm^2 and 80 km high, CO2 at 400 ppm, CO2 molecules is 8.28 x 10^21
Fraction of CO2 molecules participating in extinction is (1 x 10^19)/(8.28 x 10^21) = 0.0012, or 0.12%
This is independent of the way the excitation energy is dissipated, be-it by collisions or by radiation.
,
C.7.2, WV
.
WV is the most dominant greenhouse gas.
Above about 10 km, WV ppm is near zero.
Average concentration of WV in the TS is about 0.4% volume, or 4000 ppm.
With average WV density of 0.6 kg/m^3, in a column of air, 1 cm^2 and 10 km high, WV molecules is (volume x density/mol wgt.) x number of Avogadro x concentration, or 600 kg/29 x (6 x 10^23) x (4000 x 10^-6) = 4.96 x 10^22 molecules
.
In 150 m there is full extinction of BB radiation. It sets a time frame of 0.5 microsecond
A column of air, 1 cm^3 and 150 m high, at 288 K, at 10^5 Pa, at ρ = 1.223 kg/m3, contains 0.0183 kg air.
Air molecules is (18.3/29) x (6 x 10^23) = 3.79 x 10^23 C.1 and C.2
At 4000 ppm, within 150 m, WV molecules is (4000 x 10^-6) x (3.79 x 10^23) = 1.516 x 10^21
WV molecules participating in full extinction is (1.516 x 10^21)/(4.96 x 10^22) = 0.305 x 10^-1 = 0.0305, or 3%.
.
Average wavelength in BB radiation is about 15.4 micrometer
Energy of average photon is Ef = hc/λ = (6.626 x 10^-34) x (3 x 10^8)/(15.4 x 10^-6) = 1.291 x 10^-20 Joule
Total BB radiation is 0.0459 W/cm^2 C.6.6
Photon flux is 0.0459/(1.291 x 10^-20) = 3.56 x 10^18 per cm^2, per second
Photon extinction, within 150 m, timeframe 0.5 microsecond, is (0.5 x 10^-6) x (3.56 x 10^18) = 1.78 x 10^12 photons
Ratio of WV molecules and photons, for extinction is (1.516 x 10^21)/(1.78 x 10^12) =
8.51 x 10^8 molecule/photon.
Those percentages fully absorb the earth's BB radiation, at their specific absorption wavelengths, at 300 K. See Image 11A and URL
The rest of the WV molecules first gained their energy by evaporation, then by collisions.
The rest of the CO2 molecules, and almost all other atmosphere molecules gained their energy by collisions.
http://www.john-daly.com/forcing/hug-barrett.htm
http://www.john-daly.com/artifact.htm
Molecules near the surface have a mean free path of 64 - 68 nanometer. Even though their average speed, near the surface, is about 470 m/s, they travel very short distances before colliding with other molecules.
Near the surface, with the sun shining on land and water, dew and fog become WV, which is rising and forming clouds.
As the surface temperature increases, IR photons increase, and because of the above huge molecule to photon ratios, each 100 photons is surrounded by about 10000 million molecules, of which 177,220,000 are WV, and 4,230,000 are CO2.
The 17722 ppm value is used, because almost all IR photon absorption occurs within 200 meter from the surface. See above vertical profile image
22 photons escape to space through the atmospheric window (no collision, no absorption),
5.5 photons (7% of 100 - 22), with 15 micrometer wavelength, either thermalize by collision with all other molecules, or are absorbed by WV and CO2 molecules.
72.5 photons thermalize by collision with all other molecules
.
Near the surface, WV absorbs 17722/(17722 + 423) = 98% of the 15 micrometer photons, and CO2 2%
If CO2 were 846 ppm (not possible, due to not enough fossil fuels), WV would absorb 17722/(17722 + 846) = 95%, and CO2 5%. See image and URLs
It is dishonest to claim, WV does 39 to 62% of the energy retention/greenhouse effect, based on laboratory experiments and subjective models
Near the surface, WV absorbing IR photons totally swamps whatever CO2 does.
See dark areas regarding IR absorption in Image 11A
NOTE: This graph is based on a low value of WV at the surface of 7750 ppm. See pg. 9 of URL
https://apps.dtic.mil/sti/pdfs/ADA175173.pdf
That understates the H20 area and overstates the CO2 area (the 0 ppm squiggle should be lower).
The graph does not sufficiently account of overlap of WV and CO2 spectra.
It should be based on 14500 to 17722 ppm, because almost all IR photon extinction occurs at less than 200 meter elevation.. See pg. 4 of URL
https://clintel.org/doubling-co2-increases-absorption-by-only-a-few...
.
.
CO2 molecules absorb IR photons at four narrow bands of wavelengths, centered on 2.0, 2.7, 4.3 and 14.9 micrometers; the first three are minuscule compared to wide bands of WV molecules. See dark areas of Image 11A. CO2 molecules absorb minimal IR photons at frequencies greater than 15 micrometers
WV molecules have more bands, and those bands are much wider than of CO2 molecules, especially the bands with shorter wavelengths. See dark areas of Image 11A
WV molecules have up to 6 times wider absorption spectrum than CO2 molecules
IR photons with wavelengths from 0.8 to 70 micrometers (except the 8 - 13 micrometer window) are mostly absorbed by H2O molecules.
Each WV molecule can absorb IR photons at these wavelengths, plus WV molecules are far more abundant than CO2 molecules.
WV molecules likely are more energetic than CO2 molecules, because of their absorption of short wavelength/high energy photons. See Image 11A and c/f = y equation.
The heat of the warmed WV molecules is distributed, by means of mass transfer of energy, and conduction, convection, cloud formation/evaporation, to all molecules in the atmosphere, which mostly are 78% N2, 21% O2, and 1% Argon
That 99.9% neither absorbs nor radiates IR photons. It gets heated by contact with warmed earth surfaces (conduction) and rising warm air (convection)
After some time, that vast quantity of heat is emitted from everything in the atmosphere and earth surfaces.
APPENDIX 1
World Offshore Wind Capacity Placed on Operation in 2021
During 2021, worldwide offshore wind capacity placed in operation was 17,398 MW, of which China 13,790 MW, and the rest of the world 3,608 MW, of which UK 1,855 MW; Vietnam 643 MW; Denmark 604 MW; Netherlands 402 MW; Taiwan 109 MW
Of the 17,398 MW, just 57.1 MW was floating, about 1/3%
At end of 2021, 50,623 MW was in operation, of which just 123.4 MW was floating, about 1/4%
https://www.energy.gov/eere/wind/articles/offshore-wind-market-repo...
Floating Offshore Wind Systems in the Impoverished State of Maine
https://www.windtaskforce.org/profiles/blogs/floating-offshore-wind...
Despite the meager floating offshore MW in the world, pro-wind politicians, bureaucrats, etc., aided and abetted by the lapdog Main Media and "academia/think tanks", in the impoverished State of Maine, continue to fantasize about building 3,000 MW of 850-ft-tall floating offshore wind turbines by 2040!!
Maine government bureaucrats, etc., in a world of their own climate-fighting fantasies, want to have about 3,000 MW of floating wind turbines by 2040; a most expensive, totally unrealistic goal, that would further impoverish the already-poor State of Maine for many decades.
Those bureaucrats, etc., would help fatten the lucrative, 20-y, tax-shelters of mostly out-of-state, multi-millionaire, wind-subsidy chasers, who likely have minimal regard for:
1) Impacts on the environment and the fishing and tourist industries of Maine, and
2) Already-overstressed, over-taxed, over-regulated Maine ratepayers and taxpayers, who are trying to make ends meet in a near-zero, real-growth economy.
Those fishery-destroying, 850-ft-tall floaters, with 24/7/365 strobe lights, visible 30 miles from any shore, would cost at least $7,500/ installed kW, or at least $22.5 billion, if built in 2023 (more after 2023)
Almost the entire supply of the Maine projects would be designed and made in Europe, then transported across the Atlantic Ocean, in European specialized ships, then unloaded at a new, $500-million Maine storage/pre-assembly/staging/barge-loading area, then barged to European specialized erection ships for erection of the floating turbines. The financing will be mostly by European pension funds.
About 300 Maine people would have jobs during the erection phase
The other erection jobs would be by specialized European people, mostly on cranes and ships
About 100 Maine people would have long-term O&M jobs, using European spare parts, during the 20-y electricity production phase.
https://www.maine.gov/governor/mills/news/governor-mills-signs-bill...
The Maine woke bureaucrats are falling over each other to prove their “greenness”, offering $millions of this and that for free, but all their primping and preening efforts has resulted in no floating offshore bids from European companies
The Maine people have much greater burdens to look forward to for the next 20 years, courtesy of the Governor Mills incompetent, woke bureaucracy that has infested the state government
The Maine people need to finally wake up, and put an end to the climate scare-mongering, which aims to subjugate and further impoverish them, by voting the entire Democrat woke cabal out and replace it with rational Republicans in 2024
The present course leads to financial disaster for the impoverished State of Maine and its people.
The purposely-kept-ignorant Maine people do not deserve such maltreatment
Electricity Cost: Assume a $750 million, 100 MW project consists of foundations, wind turbines, cabling to shore, and installation at $7,500/kW.
Production 100 MW x 8766 h/y x 0.40, CF = 350,640,000 kWh/y
Amortize bank loan for $525 million, 70% of project, at 6.5%/y for 20 years, 13.396 c/kWh.
Owner return on $225 million, 30% of project, at 10%/y for 20 years, 7.431 c/kWh
Offshore O&M, about 30 miles out to sea, 8 c/kWh.
Supply chain, special ships, and ocean transport, 3 c/kWh
All other items, 4 c/kWh
Total cost 13.396 + 7.431 + 8 + 3 + 4 = 35.827 c/kWh
Less 50% subsidies (ITC, 5-y depreciation, interest deduction on borrowed funds) 17.913 c/kWh
Owner sells to utility at 17.913 c/kWh
NOTE: The above prices compare with the average New England wholesale price of about 5 c/kWh, during the 2009 - 2022 period, 13 years, courtesy of:
Gas-fueled CCGT plants, with low-cost, low-CO2, very-low particulate/kWh
Nuclear plants, with low-cost, near-zero CO2, zero particulate/kWh
Hydro plants, with low-cost, near-zero-CO2, zero particulate/kWh
Cabling to Shore Plus $Billions for Grid Expansion on Shore: A high voltage cable would be hanging from each unit, until it reaches bottom, say about 200 to 500 feet.
The cables would need some type of flexible support system
There would be about 5 cables, each connected to sixty, 10 MW wind turbines, making landfall on the Maine shore, for connection to 5 substations (each having a 600 MW capacity, requiring several acres of equipment), then to connect to the New England HV grid, which will need $billions for expansion/reinforcement to transmit electricity to load centers, mostly in southern New England.
Floating Offshore a Major Financial Burden on Maine People: Rich Norwegian people can afford to dabble in such expensive demonstration follies (See Appendix 2), but the over-taxed, over-regulated, impoverished Maine people would buckle under such a heavy burden, while trying to make ends meet in the near-zero, real-growth Maine economy. Maine folks need lower energy bills, not higher energy bills.
APPENDIX 2
Floating Offshore Wind in Norway
Equinor, a Norwegian company, put in operation, 11 Hywind, floating offshore wind turbines, each 8 MW, for a total of 88 MW, in the North Sea. The wind turbines are supplied by Siemens, a German company
Production will be about 88 x 8766 x 0.5, claimed lifetime capacity factor = 385,704 MWh/y, which is about 35% of the electricity used by 2 nearby Norwegian oil rigs, which cost at least $1.0 billion each.
On an annual basis, the existing diesel and gas-turbine generators on the rigs, designed to provide 100% of the rigs electricity requirements, 24/7/365, will provide only 65%, i.e., the wind turbines have 100% back up.
The generators will counteract the up/down output of the wind turbines, on a less-than-minute-by-minute basis, 24/7/365
The generators will provide almost all the electricity during low-wind periods, and 100% during high-wind periods, when rotors are feathered and locked.
The capital cost of the entire project was about 8 billion Norwegian Kroner, or about $730 million, as of August 2023, when all 11 units were placed in operation, or $730 million/88 MW = $8,300/kW. See URL
That cost was much higher than the estimated 5 billion NOK in 2019, i.e., 60% higher
The project is located about 70 miles from Norway, which means minimal transport costs of the entire supply to the erection sites
The project would produce electricity at about 42 c/kWh, no subsidies, at about 21 c/kWh, with 50% subsidies
In Norway, all work associated with oil rigs is very expensive.
Three shifts of workers are on the rigs for 6 weeks, work 60 h/week, and get 6 weeks off with pay, and are paid well over $150,000/y, plus benefits.
If Norwegian units were used in Maine, the production costs would be even higher in Maine, because of the additional cost of transport of almost the entire supply, including specialized ships and cranes, across the Atlantic Ocean, plus
A high voltage cable would be hanging from each unit, until it reaches bottom, say about 200 to 500 feet.
The cables would need some type of flexible support system
The cables would be combined into several cables to run horizontally to shore, for at least 25 to 30 miles, to several onshore substations, to the New England high voltage grid.
.
https://www.offshore-mag.com/regional-reports/north-sea-europe/arti...
https://en.wikipedia.org/wiki/Floating_wind_turbine
.
.
APPENDIX 3
Offshore Wind in US and UK
Most folks, seeing only part of the picture, write about wind energy issues that only partially cover the offshore wind situation, which caused major declines of the stock prices of Siemens, Oersted, etc., starting at the end of 2020; the smart money got out
All this well before the Ukraine events, which started in February 2022. See costs/kWh in below article
World’s Largest Offshore Wind System Developer Abandons Two Major US Projects as Wind/Solar Bust Continues
https://www.windtaskforce.org/profiles/blogs/world-s-largest-offsho...
US/UK Governments Offshore Wind Goals
1) 30,000 MW of offshore by 2030, by the cabal of climate extremists in the US government
2) 36,000 MW of offshore by 2030, and 40,000 MW by 2040, by the disfunctional UK government
Those US/UK goals were physically unachievable, even if there were abundant, low-cost financing, and low inflation, and low-cost energy, materials, labor, and a robust, smooth-running supply chain, to place in service about 9500 MW of offshore during each of the next 7 years, from start 2024 to end 2030, which has never been done before in such a short time. See URL
US/UK 66,000 MW OF OFFSHORE WIND BY 2030; AN EXPENSIVE FANTASY
https://www.windtaskforce.org/profiles/blogs/biden-30-000-mw-of-off...
US Offshore Wind Electricity Production and Cost
Electricity production about 30,000 MW x 8766 h/y x 0.40, lifetime capacity factor = 105,192,000 MWh, or 105.2 TWh. The production would be about 100 x 105.2/4000 = 2.63% of the annual electricity loaded onto US grids.
Electricity Cost, c/kWh: Assume a $550 million, 100 MW project consists of foundations, wind turbines, cabling to shore, and installation, at $5,500/kW.
Production 100 MW x 8766 h/y x 0.40, CF = 350,640,000 kWh/y
Amortize bank loan for $385 million, 70% of project, at 6.5%/y for 20 y, 9.824 c/kWh.
Owner return on $165 million, 30% of project, at 10%/y for 20 y, 5.449 c/kWh
Offshore O&M, about 30 miles out to sea, 8 c/kWh.
Supply chain, special ships, ocean transport, 3 c/kWh
All other items, 4 c/kWh
Total cost 9.824 + 5.449 + 8 + 3 + 4 = 30.273 c/kWh
Less 50% subsidies (ITC, 5-y depreciation, interest deduction on borrowed funds) 15.137 c/kWh
Owner sells to utility at 15.137 c/kWh; developers in NY state, etc., want much more. See Above.
Not included: At a future 30% wind/solar penetration on the grid:
Cost of onshore grid expansion/reinforcement, about 2 c/kWh
Cost of a fleet of plants for counteracting/balancing, 24/7/365, about 2.0 c/kWh
In the UK, in 2020, it was 1.9 c/kWh at 28% wind/solar loaded onto the grid
Cost of curtailments, about 2.0 c/kWh
Cost of decommissioning, i.e., disassembly at sea, reprocessing and storing at hazardous waste sites
.
APPENDIX 4
Levelized Cost of Energy Deceptions, by US-EIA, et al.
Most people have no idea wind and solar systems need grid expansion/reinforcement and expensive support systems to even exist on the grid.
With increased annual W/S electricity percent on the grid, increased grid investments are needed, plus greater counteracting plant capacity, MW, especially when it is windy and sunny around noon-time.
Increased counteracting of the variable W/S output, places an increased burden on the grid’s other generators, causing them to operate in an inefficient manner (more Btu/kWh, more CO2/kWh), which adds more cost/kWh to the offshore wind electricity cost of about 16 c/kWh, after 50% subsidies
The various cost/kWh adders start with annual W/S electricity at about 8% on the grid.
The adders become exponentially greater, with increased annual W/S electricity percent on the grid
The US-EIA, Lazard, Bloomberg, etc., and their phony LCOE "analyses", are deliberately understating the cost of wind, solar and battery systems
Their LCOE “analyses” of W/S/B systems purposely exclude major LCOE items.
Their deceptions reinforced the popular delusion, W/S are competitive with fossil fuels, which is far from reality.
The excluded LCOE items are shifted to taxpayers, ratepayers, and added to government debts.
W/S would not exist without at least 50% subsidies
W/S output could not be physically fed into the grid, without items 2, 3, 4, 5, and 6. See list.
1) Subsidies equivalent to about 50% of project lifetime owning and operations cost,
2) Grid extension/reinforcement to connect remote W/S systems to load centers
3) A fleet of quick-reacting power plants to counteract the variable W/S output, on a less-than-minute-by-minute basis, 24/7/365
4) A fleet of power plants to provide electricity during low-W/S periods, and 100% during high-W/S periods, when rotors are feathered and locked,
5) Output curtailments to prevent overloading the grid, i.e., paying owners for not producing what they could have produced
6) Hazardous waste disposal of wind turbines, solar panels and batteries. See image.
.
.
APPENDIX 5
BATTERY SYSTEM CAPITAL COSTS, OPERATING COSTS, ENERGY LOSSES, AND AGING
https://www.windtaskforce.org/profiles/blogs/battery-system-capital...
EXCERPT:
Annual Cost of Megapack Battery Systems; 2023 pricing
Assume a system rated 45.3 MW/181.9 MWh, and an all-in turnkey cost of $104.5 million, per Example 2
Amortize bank loan for 50% of $104.5 million at 6.5%/y for 15 years, $5.484 million/y
Pay Owner return of 50% of $104.5 million at 10%/y for 15 years, $6.765 million/y (10% due to high inflation)
Lifetime (Bank + Owner) payments 15 x (5.484 + 6.765) = $183.7 million
Assume battery daily usage for 15 years at 10%, and loss factor = 1/(0.9 *0.9)
Battery lifetime output = 15 y x 365 d/y x 181.9 MWh x 0.1, usage x 1000 kWh/MWh = 99,590,250 kWh to HV grid; 122,950,926 kWh from HV grid; 233,606,676 kWh loss
(Bank + Owner) payments, $183.7 million / 99,590,250 kWh = 184.5 c/kWh
Less 50% subsidies (ITC, depreciation in 5 years, deduction of interest on borrowed funds) is 92.3c/kWh
At 10% throughput, (Bank + Owner) cost, 92.3 c/kWh
At 40% throughput, (Bank + Owner) cost, 23.1 c/kWh
Excluded costs/kWh: 1) O&M; 2) system aging, 1.5%/y, 3) 20% HV grid-to-HV grid loss, 4) grid extension/reinforcement to connect battery systems, 5) downtime of parts of the system, 6) decommissioning in year 15, i.e., disassembly, reprocessing and storing at hazardous waste sites. Excluded costs would add at least 10 - 15 c/kWh
NOTE: The 40% throughput is close to Tesla’s recommendation of 60% maximum throughput, i.e., not charging above 80% full and not discharging below 20% full, to achieve a 15-y life, with normal aging
NOTE: Tesla’s recommendation was not heeded by the Owners of the Hornsdale Power Reserve in Australia. They excessively charged/discharged the system. After a few years, they added Megapacks to offset rapid aging of the original system, and added more Megapacks to increase the rating of the expanded system.
COMMENTS ON CALCULATION:
Regarding any project, the bank and the owner have to be paid.
Therefore, I amortized the bank loan and the owner’s investment
If you divide the total of the payments over 15 years by the throughput during 15 years, you get the cost per kWh, as shown.
According to EIA annual reports, almost all battery systems have throughputs less than 10%. I chose 10% for calculations.
A few battery systems have higher throughputs, if they are used to absorb midday solar and discharge it the during peak hour periods of late-afternoon/early-evening. They may reach up to 40% throughput. I chose 40% for calculations.
Remember, you have to draw about 50 MWh from the HV grid to deliver about 40 MWh to the HV grid, because of A-to-Z system losses. That gets worse with aging.
A lot of people do not like these c/kWh numbers, because they have been repeatedly told by self-serving folks, low-cost battery Nirvana is just around the corner, which is a load of crap.
APPENDIX 6
SolarEdge Technologies shares plunged about two weeks ago, after it warned about decreasing European demand.
Solar Panels Are Much More Carbon-Intensive Than Experts are Willing to Admit
https://www.windtaskforce.org/profiles/blogs/solar-panels-are-more-...
SolarEdge Melts Down After Weak Guidance
https://www.windtaskforce.org/profiles/blogs/wind-solar-implosion-s...
The Great Green Crash – Solar Down 40%
https://wattsupwiththat.com/2023/11/08/the-great-green-crash-solar-...
APPENDIX 7
World's Largest Offshore Wind System Developer Abandons Two Major US Projects as Wind/Solar Bust Continues
https://www.windtaskforce.org/profiles/blogs/world-s-largest-offsho...
US/UK 66,000 MW OF OFFSHORE WIND BY 2030; AN EXPENSIVE FANTASY
https://www.windtaskforce.org/profiles/blogs/biden-30-000-mw-of-off...
BATTERY SYSTEM CAPITAL COSTS, OPERATING COSTS, ENERGY LOSSES, AND AGING
https://www.windtaskforce.org/profiles/blogs/battery-system-capital...
Regulatory Rebuff Blow to Offshore Wind Projects; Had Asked for Additional $25.35 billion
https://www.windtaskforce.org/profiles/blogs/regulatory-rebuff-blow...
Offshore Wind is an Economic and Environmental Catastrophe
https://www.windtaskforce.org/profiles/blogs/offshore-wind-is-an-ec...
Four NY offshore projects ask for almost 50% price rise
https://www.windtaskforce.org/profiles/blogs/four-ny-offshore-proje...
EV Owners Facing Soaring Insurance Costs in the US and UK
https://www.windtaskforce.org/profiles/blogs/ev-owners-facing-soari...
U.S. Offshore Wind Plans Are Utterly Collapsing
https://www.windtaskforce.org/profiles/blogs/u-s-offshore-wind-plan...
Values Of Used EVs Plummet, As Dealers Stuck With Unsold Cars
https://www.windtaskforce.org/profiles/blogs/values-of-used-evs-plu...
Electric vehicles catch fire after being exposed to saltwater from Hurricane Idalia
https://www.windtaskforce.org/profiles/blogs/electric-vehicles-catc...
The Electric Car Debacle Shows the Top-Down Economics of Net Zero Don’t Add Up
https://www.windtaskforce.org/profiles/blogs/the-electric-car-debac...
Lifetime Performance of World’s First Offshore Wind System in the North Sea
https://www.windtaskforce.org/profiles/blogs/lifetime-performance-o...
Solar Panels Are Much More Carbon-Intensive Than Experts are Willing to Admit
https://www.windtaskforce.org/profiles/blogs/solar-panels-are-more-...
IRENA, a Renewables Proponent, Ignores the Actual Cost Data for Offshore Wind Systems in the UK
https://www.windtaskforce.org/profiles/blogs/irena-a-european-renew...
UK Offshore Wind Projects Threaten to Pull Out of Uneconomical Contracts, unless Subsidies are Increased
https://www.windtaskforce.org/profiles/blogs/uk-offshore-wind-proje...
CO2 IS A LIFE GAS; NO CO2 = NO FLORA AND NO FAUNA
https://www.windtaskforce.org/profiles/blogs/co2-is-a-life-gas-no-c...
AIR SOURCE HEAT PUMPS DO NOT ECONOMICALLY DISPLACE FOSSIL FUEL BTUs IN COLD CLIMATES
https://www.windtaskforce.org/profiles/blogs/air-source-heat-pumps-...
.
IRELAND FUEL AND CO2 REDUCTIONS DUE TO WIND ENERGY LESS THAN CLAIMED
https://www.windtaskforce.org/profiles/blogs/fuel-and-co2-reduction...
APPENDIX 8
Nuclear Plants by Russia
According to the IAEA, during the first half of 2023, a total of 407 nuclear reactors are in operation at power plants across the world, with a total capacity at about 370,000 MW
Nuclear was 2546 TWh, or 9.2%, of world electricity production in 2022
https://www.windtaskforce.org/profiles/blogs/batteries-in-new-england
Rosatom, a Russian Company, is building more nuclear reactors than any other country in the world, according to data from the Power Reactor Information System of the International Atomic Energy Agency, IAEA.
The data show, a total of 58 large-scale nuclear power reactors are currently under construction worldwide, of which 23 are being built by Russia.
.
In Egypt, 4 reactors, each 1,200 MW = 4,800 MW for $30 billion, or about $6,250/kW,
The cost of the nuclear power plant is $28.75 billion.
As per a bilateral agreement, signed in 2015, approximately 85% of it is financed by Russia, and to be paid for by Egypt under a 22-year loan with an interest rate of 3%.
That cost is at least 40% less than US/UK/EU
.
In Turkey, 4 reactors, each 1,200 MW = 4,800 MW for $20 billion, or about $4,200/kW, entirely financed by Russia. The plant will be owned and operated by Rosatom
.
In India, 6 VVER-1000 reactors, each 1,000 MW = 6,000 MW at the Kudankulam Nuclear Power Plant.
Capital cost about $15 billion. Units 1, 2, 3 and 4 are in operation, units 5 and 6 are being constructed
In Bangladesh: 2 VVER-1200 reactors = 2400 MW at the Rooppur Power Station
Capital cost $12.65 billion is 90% funded by a loan from the Russian government. The two units generating 2400 MW are planned to be operational in 2024 and 2025. Rosatom will operate the units for the first year before handing over to Bangladeshi operators. Russia will supply the nuclear fuel and take back and reprocess spent nuclear fuel.
https://en.wikipedia.org/wiki/Rooppur_Nuclear_Power_Plant
.
Rosatom, created in 2007 by combining several Russian companies, usually provides full service during the entire project life, such as training, new fuel bundles, refueling, waste processing and waste storage in Russia, etc., because the various countries likely do not have the required systems and infrastructures
Nuclear: Remember, these nuclear plants reliably produce steady electricity, at reasonable cost/kWh, and have near-zero CO2 emissions
They have about 0.90 capacity factors, and last 60 to 80 years
Nuclear do not require counteracting plants. They can be designed to be load-following, as some are in France
.
Wind: Offshore wind systems produce variable, unreliable power, at very high cost/kWh, and are far from CO2-free, on a mine-to-hazardous landfill basis.
They have lifetime capacity factors, on average, of about 0.40; about 0.45 in very windy places
They last about 20 to 25 years in a salt water environment
They require: 1) a fleet of quick-reacting power plants to counteract the up/down wind outputs, on a less-than-minute-by-minute basis, 24/7/365, 2) major expansion/reinforcement of electric grids to connect the wind systems to load centers, 3) a lot of land and sea area, 4) curtailment payments, i.e., pay owners for what they could have produced
Major Competitors: Rosatom’s direct competitors, according to PRIS data, are three Chinese companies: CNNC, CSPI and CGN.
They are building 22 reactors, but it should be noted, they are being built primarily inside China, and the Chinese partners are building five of them together with Rosatom.
American and European companies are lagging behind Rosatom, by a wide margin,” Alexander Uvarov, a director at the Atom-info Center and editor-in-chief at the atominfo.ru website, told TASS.
Tripling Nuclear A Total Fantasy: During COP28, Kerry called for the world to triple nuclear, from 370,200 MW to 1,110,600 MW, by 2050.
https://phys.org/news/2023-12-triple-nuclear-power-cop28.html
Based on past experience in the US and EU, it takes at least 10 years to commission nuclear plants
Plants with about 39 reactors must be started each year, for 16 years (2024 to 2040), to fill the pipeline, to commission the final ones by 2050, in addition to those already in the pipeline.
New nuclear: Kerry’s nuclear tripling by 2050, would add 11% of world electricity generation in 2050. See table
Nuclear was 9.2% of 2022 generation. That would become about 5% of 2050 generation, if some older plants are shut down, and plants already in the pipeline are placed in operation,
Total nuclear would be 11+ 5 = 16%; minimal impact on CO2 emissions and ppm in 2050.
Infrastructures and Manpower: The building of the new nuclear plants would require a major increase in infrastructures and educating and training of personnel, in addition to the cost of the power plants.
https://www.visualcapitalist.com/electricity-sources-by-fuel-in-202....
APPENDIX 9
Electricity prices vary by type of customer
Retail electricity prices are usually highest for residential and commercial consumers because it costs more to distribute electricity to them. Industrial consumers use more electricity and can receive it at higher voltages, so supplying electricity to these customers is more efficient and less expensive. The retail price of electricity to industrial customers is generally close to the wholesale price of electricity.
In 2022, the U.S. annual average retail price of electricity was about 12.49¢ per kilowatthour (kWh).1
The annual average retail electricity prices by major types of utility customers in 2022 were:
Residential, 15.12 ¢/kWh; Commercial, 12.55 ¢/kWh; Industrial, 8.45 ¢/kWh; Transportation, 11.66 ¢/kWh
Electricity prices vary by locality
Electricity prices vary by locality based on the availability of power plants and fuels, local fuel costs, and pricing regulations. In 2022, the annual average retail electricity price for all types of electric utility customers ranged from 39.85¢ per kWh in Hawaii to 8.24¢ per kWh in Wyoming.2.
Prices in Hawaii are high relative to other states mainly because most of its electricity is generated with petroleum fuels that must be imported into the state.
1 U.S. Energy Information Administration, Electric Power Monthly, Table 5.3, February 2023, preliminary data.
2 U.S. Energy Information Administration, Electric Power Monthly, Table 5.6.B, February 2023, preliminary data.
Last updated: June 29, 2023, with data from the Electric Power Monthly, February 2023; data for 2022 are preliminary.
See URL
https://www.eia.gov/energyexplained/electricity/prices-and-factors-...
In the US, the cost of electricity to ratepayers ranges from about 8 c/kWh (Wyoming) to 40 c/kWh (Hawaii), for an average of about 12.5 c/kWh.
US ratepayers buy about 4000 billion kWh/y from utilities, costing about $500 BILLION/Y
With a lot of wind/solar/batteries/EVs by 2050, and ratepayers buying 8000 billion kWh/y, because of electrification, the average rate to ratepayers would be about 25 c/kWh,
US ratepayers would pay: two times the kWh x two times the price/kWh = $2,000 BILLION/Y
Electric bills would increase by a factor of 4, if all that scare-mongering renewable nonsense were implemented
NOTE: All numbers are without inflation, i.e., constant 2023 dollars
APPENDIX 10
LIFE WITHOUT OIL?
Life without oil means many products that are made with oil, such as the hundreds listed below, would need to be provided by wind and solar and hydro, which can be done theoretically, but only at enormous cost.
Folks, including Biden's handlers, wanting to get rid of fossil fuels, such as crude oil, better start doing some rethinking.
The above also applies to natural gas, which is much preferred by many industries, such as glass making, and the chemical and drug industries.
If you do not have abundant, low-cost energy, you cannot have modern industrial economies.
Without Crude Oil, there can be no Electricity.
Every experienced engineer knows, almost all the parts of wind, solar and battery systems, for electricity generation and storage, from mining materials to manufacturing parts, to installation and commissioning, in addition to the infrastructures that produce materials, parts, specialized ships, etc., are made from the oil derivatives manufactured from raw crude oil.
.
Views: 217
Comment
Maine as Third World Country:
CMP Transmission Rate Skyrockets 19.6% Due to Wind Power
Click here to read how the Maine ratepayer has been sold down the river by the Angus King cabal.
Maine Center For Public Interest Reporting – Three Part Series: A CRITICAL LOOK AT MAINE’S WIND ACT
******** IF LINKS BELOW DON'T WORK, GOOGLE THEM*********
(excerpts) From Part 1 – On Maine’s Wind Law “Once the committee passed the wind energy bill on to the full House and Senate, lawmakers there didn’t even debate it. They passed it unanimously and with no discussion. House Majority Leader Hannah Pingree, a Democrat from North Haven, says legislators probably didn’t know how many turbines would be constructed in Maine if the law’s goals were met." . – Maine Center for Public Interest Reporting, August 2010 https://www.pinetreewatchdog.org/wind-power-bandwagon-hits-bumps-in-the-road-3/From Part 2 – On Wind and Oil Yet using wind energy doesn’t lower dependence on imported foreign oil. That’s because the majority of imported oil in Maine is used for heating and transportation. And switching our dependence from foreign oil to Maine-produced electricity isn’t likely to happen very soon, says Bartlett. “Right now, people can’t switch to electric cars and heating – if they did, we’d be in trouble.” So was one of the fundamental premises of the task force false, or at least misleading?" https://www.pinetreewatchdog.org/wind-swept-task-force-set-the-rules/From Part 3 – On Wind-Required New Transmission Lines Finally, the building of enormous, high-voltage transmission lines that the regional electricity system operator says are required to move substantial amounts of wind power to markets south of Maine was never even discussed by the task force – an omission that Mills said will come to haunt the state.“If you try to put 2,500 or 3,000 megawatts in northern or eastern Maine – oh, my god, try to build the transmission!” said Mills. “It’s not just the towers, it’s the lines – that’s when I begin to think that the goal is a little farfetched.” https://www.pinetreewatchdog.org/flaws-in-bill-like-skating-with-dull-skates/
Not yet a member?
Sign up today and lend your voice and presence to the steadily rising tide that will soon sweep the scourge of useless and wretched turbines from our beloved Maine countryside. For many of us, our little pieces of paradise have been hard won. Did the carpetbaggers think they could simply steal them from us?
We have the facts on our side. We have the truth on our side. All we need now is YOU.
“First they ignore you, then they laugh at you, then they fight you, then you win.”
-- Mahatma Gandhi
"It's not whether you get knocked down: it's whether you get up."
Vince Lombardi
Task Force membership is free. Please sign up today!
Hannah Pingree on the Maine expedited wind law
Hannah Pingree - Director of Maine's Office of Innovation and the Future
"Once the committee passed the wind energy bill on to the full House and Senate, lawmakers there didn’t even debate it. They passed it unanimously and with no discussion. House Majority Leader Hannah Pingree, a Democrat from North Haven, says legislators probably didn’t know how many turbines would be constructed in Maine."
https://pinetreewatch.org/wind-power-bandwagon-hits-bumps-in-the-road-3/
© 2024 Created by Webmaster.
Powered by
![]()
You need to be a member of Citizens' Task Force on Wind Power - Maine to add comments!
Join Citizens' Task Force on Wind Power - Maine