The scientific truth is simple:
Sea levels are rising, but the rate of rise has not increased.
A new peer-reviewed study confirms what many other studies have already shown – the steady rise of oceans is a centuries-long process, not a runaway crisis, triggered by modern emissions of carbon dioxide (CO2).
.
Some Comments on Image
The image is a composite of at least 10 data sources in various locations
The image shows the period with most land-ice was about 22000 years ago (the period with the coldest temperatures was about 26500 years ago).
The North Sea, English Channel and Irish Sea, plus many seas and bays, did not exist. The Isle of Man was just a hill.
The sea level increased by at least 120 METERS during the past 22000 years, due to land-ice melting.
Initially, the melting was slow for about 7000 years, then greatly accelerated for about 4000 years, then at a steady rate for about 2000 years, then leveled off during the past 9000 years.
Currently, the worldwide average increase is about 1 to 2 millimeter per year.
.
About 30,000 years ago, England was connected with Europe
The Rhine River ran as far north as the south of Denmark
The Thames River was a tributary of the Rhine
Rising sea levels created the North Sea and English Channel
About 8100 years ago, sea levels were at least 15 METERS lower that at present, and the UK was still connected to Europe with a narrow land bridge
At that time, there was a land slide off the Norwegian coast, which created a Tsunami, and the land bridge was gone.
The Isle of Wight is a left-over part of that narrow land bridge
.

.
SOME HISTORY
For the past 12,000 years, during our current warm epoch known as the Holocene, sea levels have risen and fallen dramatically.
For instance, during the very recent 600-y Little Ice Age, which ended in the 1850s, sea levels dropped significantly. The coldest period was the late 1600s
The natural warming, that began about 1690 got to a point, where loss of land-ice in the summers of the 1800s finally began to exceed the land-ice gain during the winters.
As a result, the glaciers began to recede and shrink and sea levels rose.
By 1850, full-on glacial retreat was underway.
All of the above land-ice melting took place before there were any CO2 emissions from fossil fuels
.
Thus, the current period of gradual sea-level increase began between 1800-1860.
That PRECEDED any significant human CO2 emissions by many decades.
The U.S. Department of Energy’s 2025 critical review on CO2 and climate change confirms this historical perspective.
.
“There is no good, sufficient or convincing evidence, global sea level rise is accelerating –there is only hypothesis and speculation.
"Computation is not evidence and unless the results can be practically viewed and measured in the physical world, such results must not be presented as such,” notes Kip Hansen, researcher and former U.S. Coast Guard captain.
.
New Study Confirms No Crisis
While activists speak of “global sea-level rise,” the ocean’s surface does not behave like water in a bathtub. Regional currents, land movements (up/down/sideways), and local hydrology all influence relative sea level. .
This is why local tide gauge data is important. As Hansen warns, “Only actually measured, validated raw data can be trusted. … You have to understand exactly what’s been measured and how.”
.
In addition, local tide-gauge data cannot be extrapolated to represent global sea level. This is because the geographic coverage of suitable locations for gauges is often poor, with the majority concentrated in the Northern Hemisphere.
Latin America and Africa are severely under-represented in the global dataset.
Hansen says, “The global tide gauge record is quantitatively problematic, but individual records can be shown as qualitative evidence for a lack of sea-level rise acceleration.”
.
A new 2025 study provides confirmation
Published in the Journal of Marine Science and Engineering, the study systematically dismantles the narrative of accelerating sea-level rise.
It analyzed empirically derived long-term rates from datasets of sufficient length – at least 60 years – and incorporated long-term tide signals from suitable locations.
The startling conclusion: Approximately 95% of monitoring locations show no statistically significant acceleration of sea-level rise.
It was found that the steady rate of sea-level rise – averaging around 1 to 2 millimeters per year globally – mirrors patterns observed over the past 150 years.
.
The study suggests, projections by the Intergovernmental Panel on Climate Change (IPCC), which often predicts rates as high as 3 to 4 millimeters per year by 2100, overestimate the annual rise by approximately 2 millimeters, at least 100%.
.
This discrepancy is not trivial.
It translates into billions of dollars in misguided infrastructure investments and adaptation policies, which assume a far worse scenario than what the data support.
Because we now know that local, non-climatic phenomena are a plausible cause of the accelerated sea level rise measured locally.
Rather than pursuing economically destructive initiatives to reduce greenhouse gas emissions on the basis of questionable projections and erroneous climate science, money and time should be invested in supporting coastal communities with accurate data for practical planning to adapt to local sea level rise.
Successful adaptation strategies have existed for centuries in regions prone to flooding and sea-level variations.
The Netherlands is an excellent example of how engineering solutions can protect a 12 million coastal population living up to 6 meter below sea level, such as Rotterdam, a city with more than a million people.
.
Slowly rising sea levels are real but not a crisis.
What we have is a manageable, predictable phenomenon to which societies have adapted for centuries.
To inflate it into an existential threat is to mislead, misallocate, and ultimately harm the communities that policymakers claim to protect.
.
Vijay Jayaraj is a Science and Research Associate at the CO2 Coalition, Fairfax, Virginia. He holds an M.S. in environmental sciences from the University of East Anglia and a postgraduate degree in energy management from Robert Gordon University, both in the U.K., and a bachelor’s in engineering from Anna University, India.
.
APPENDIX
Thermometer record shows global warming starting long before the 1950’s
We had warming from the 1910’s to the 1940’s, and then cooling from the 1940’s to the 1970’s, and then warming from the 1980’s into the 2000’s, where the temperatures have peaked, as they did in the 1930’s, and now a cooling trend has appeared.
.
Here’s the U.S. chart (Hansen 1999) showing warming and cooling before 1979, and then the UAH satellite chart showing the warming and cooling from 1979 to present.
.
As you can see, there was warming in North America in the recent past.
You don’t have to go back hundreds or thousands of years to find a period that was just as warm, or warmer, than today.
The Early Twentieth Century was just as warm as today, as recorded in numerous written temperature charts from all over the world.
Hansen chart of 1999:

University of Alabama, Huntington Campus
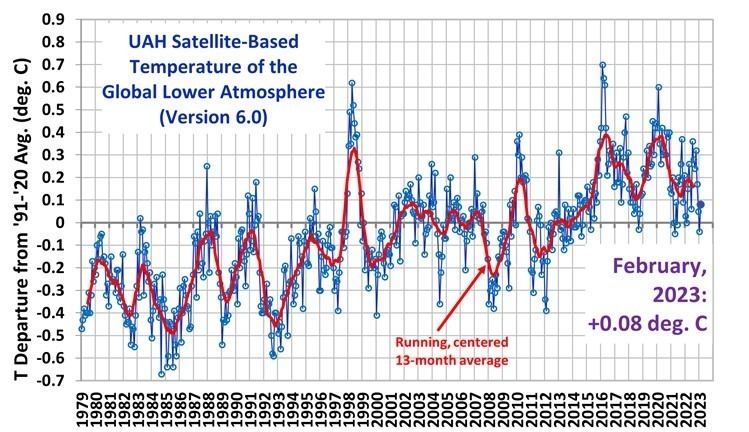
Combined, these two charts represent the real temperature profile of the Earth, where it was just as warm in the recent past as it is today.
The CO2 has had no visible effect on temperatures
There is much more CO2 is in the air today, than was in the air in the Early Twentieth Century, yet it is no warmer today that it was then.
This is the BIG LIE the climate-change alarmists tell.
It is refuted by the written temperature record, which is available to just about anyone who cares to look.
One has to wonder why all the alarmist experts, and some of those on the skeptic side, continue to ignore the Early Twentieth Century, and the bastardization that has taken place to erase the Early Twentieth Century from memory.
The written temperature record and the Early Twentieth Century temperatures repudiate the Catastrophic Anthropogenic Global Warming (CAGW) claims of the Alarmists.
That’s all you need, as proof that CO2 has no discernible effect on the Earth’s atmosphere.
Almost 100 years of increased CO2 going into the atmosphere, yet it is no warmer today than it was then.
Climate models, like the ones that the EPA is using, have been consistently wrong for decades in predicting actual outcomes, Mr. Happer told The Epoch Times. He presented the table below to the EPA to illustrate his point.
.
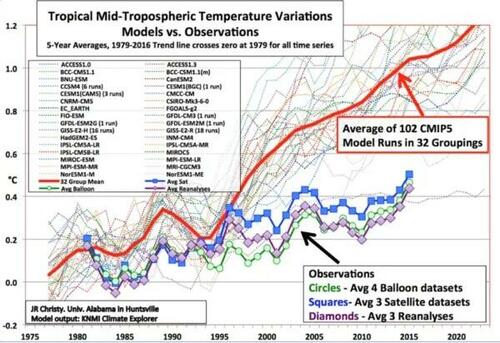
Modeled climate predictions (average shown by red line) versus actual observations (source: J.R. Christy, Univ. of Alabama; KNMI Climate Explorer)
.
“That was already an embarrassment in the ‘90s, when I was director of energy research in the U.S. Department of Energy,” he said. “I was funding a lot of this work, and I knew very well at that time, the models were over-predicting the warming by a huge amount.”
.
He and his colleague argued, the EPA has grossly overstated the harm from CO2 emissions, while ignoring the benefits of CO2 to life on Earth.
What’s left to say?
CO2 is a Life Gas; No CO2 = No Flora and Fauna
https://www.windtaskforce.org/profiles/blogs/co2-is-a-life-gas-no-c...
Lying with Statistics
The first image shows the temperature increase in a human scale, from 1880 to 2020
The increase is barely visible.
It could be due to coming out ofc the Little Ice Age, or CO2, or increased urbanization
The second image shows the same data on a greatly magnified vertical scale.
Central England Temperatures
This is the longest continuous temperature record with a thermometer.
CO2 increased exponentially, but Central England temperatures did not respond at all.
CO2 was about constant from 1559 to 1850
CO2 has been increasing since 1855
A one degree C temperature increase from 1659 to 2009, does not come close to the increase in CO2.
There was a temperature increase from about 1720 to about 1736, while CO2 remained constant.
There was a smaller increase from about 1988 to about 2009, which cannot be attributed to CO2.
.
You need to be a member of Citizens' Task Force on Wind Power - Maine to add comments!
Join Citizens' Task Force on Wind Power - Maine