WILL WIND, SOLAR, HYDRO, BIO, WASTE AND ENERGY STORAGE BE ECONOMICALLY VIABLE?
100% RE aficionados, almost all of them never even designed, analyzed and operated any energy system, claim wind and solar, and hydro + bio + waste, and energy storage, and demand management, and energy efficiency, and heat pumps and the batteries of electric vehicles will provide electricity, at a minimum of 99.97% reliability, 24/7/365.
They likely do not know it takes only 40% of all US primary energy to generate electricity. That leaves 60% which would be much more difficult to obtain from RE. For example, it took about 31 million acres of corn cropping to produce 10% of all the E10 gasoline consumed in 2017.
http://www.windtaskforce.org/profiles/blogs/politically-inspired-ma...
They claim their envisioned system will be “distributed” everywhere, and it will have lower electricity costs per kWh, because “it does not use fuel”.
However, for many years, independent energy systems analysts have warned New Englanders much higher electric rates would happen with increased build-outs of heavily-subsidized wind and solar, but legislators, etc., pooh-poohed them.
Now, with utilities getting 5%/y rate increases year after year, New Englanders are finally beginning to learn the 100% RE fantasy is, in fact, a load of bull manure.
NOTE: If 100% RE aficionados were correct, why do countries in the EU, with high levels of wind and solar, also have high household electric rates, such as Germany and Denmark? Their governments have kept the commercial/industrial rates low for competitive reasons. The taxes, fees and surcharges are imposed mostly on household rates. Why would that scenario be any different in New England? See URLs.
http://euanmearns.com/an-update-on-the-energiewende/
http://www.windtaskforce.org/profiles/blogs/wind-and-solar-hype-ver...
ISO-NE Projections of Wind and Solar
ISO-NE, with inputs from the states, has prepared estimates of projected build-outs of solar and wind in New England. In table 1, the values for 2017 are actuals. The remaining values are from the URls. The capital costs were calculated. Excess means additional electricity cost above the present annual average electricity wholesale price, which has been a steady 5 c/kWh since 2009.
New Englanders would have to invest $49.40 billion in wind and solar and grid expansion, and pay at least $3.2 billion more for electricity each year, plus, at such high levels of variable wind and solar, the gas turbine plants performing the peaking, filling-in and balancing would operate less efficiently (more Btu/kWh, more CO2/kWh), as they do in Ireland. See table 1 and URL.
http://www.windtaskforce.org/profiles/blogs/fuel-and-co2-reductions...
NOTE: Vermont's estimated solar production, before and after the meter, is 345 GWh in 2018 from 288.7 MW ac of panels, about 345/6000 = 5.75% of Vermont’s load on the NE grid, per ISO-NE.
https://www.iso-ne.com/static-assets/documents/2018/03/a03-2018-pv-...
https://www.iso-ne.com/static-assets/documents/2018/02/02272018_pr_...
https://www.iso-ne.com/about/key-stats/resource-mix/
https://www.energy.gov/sites/prod/files/2017/08/f35/2016%20Offshore...
http://www.windtaskforce.org/profiles/blogs/a-likely-scenario-durin...
Table 1 |
2017 |
2018 |
2018 |
2027 |
2027 |
Capital Cost |
Cost |
Excess |
Solar |
GWh |
GWh |
% of load |
GWh |
% of load |
$billion |
c/kWh |
$million |
ATM |
880 |
1055 |
2147 |
12.0 |
150.29 |
|||
BTM |
1986 |
2381 |
5284 |
18.0 |
686.92 |
|||
Total |
2866 |
3436 |
2.78 |
7431 |
5.82 |
13.20 |
837.21 |
|
2017 |
2018 |
2035 |
2035 |
|||||
Wind |
||||||||
Onshore |
11650 |
14.27 |
9.5 |
524.25 |
||||
Offshore |
14247 |
21.94 |
18.0 |
1852.11 |
||||
Total |
3280 |
2.67 |
25897 |
21.08 |
36.20 |
2376.36 |
||
Total |
6146 |
3436 |
5.45 |
33328 |
26.90 |
49.40 |
3213.57 |
Closing Oil, Coal and Nuclear Plants, Requires More Gas Turbine Plant Capacity
Based on ISO-NE projections, wind would be about 21.08%, in about 2035 and solar about 5.82%, in about 2027. Such a large presence of variable intermittent electricity on the NE grid would require peaking, filling-in and balancing, 24/7/365, mostly by a large capacity of gas turbine plants.
- The sum of wind and solar is near zero many hours of the year, especially during the summer and during the December - February period (as proven by minute-by-minute NE grid operating data for at least the past 10 years).
http://www.windtaskforce.org/profiles/blogs/daily-shifting-of-wind-...
- That means the gas turbine plants, along with some minor sources, such as refuse, wood, landfill gas, methane, and hydro (NE generated + imports), and some battery and other storage, would have to be ready, staffed and fueled to serve the entire NE load, at a minimum reliability of 99.97%, 24/7/365
- Any electricity passing through storage would have up to a 20% loss on an AC-to-AC basis, which has to be made up with additional generation. See Appendix 1.
- Assuming oil, coal and nuclear plants would have been forced into retirement, a much larger capacity of gas turbine plants would be needed to replace their electricity (remember wind and solar could be near-zero)
- Additional gas lines would be needed to provide an increased quantity of low-cost, domestic natural gas to partially offset the excess electricity costs due to increased wind and solar. See table 1.
- If that increased gas quantity were from Russian and other foreign liquefied natural gas, LNG, the price would be at least 3 times domestic pipeline gas.
- 100% RE proponents and legislatures in Massachusetts and New York State have been obstructing any new gas lines to provide increased domestic natural gas, because, they say, that would be “building out fossil infrastructure”, so they want to “temporarily” use increased Russian and other foreign LNG.
- “Temporarily” actually means for several decades, because build-outs of wind and solar are very slow.
Are these people nuts, subversive, unpatriotic or what?
Do they not care about increasing the trade deficit?
Do they not understand shutting down oil, coal, and nuclear plants, requires reliable replacements?
Do they have any sense of economics? See Appendix.
http://www.windtaskforce.org/profiles/blogs/a-very-expensive-offsho...
http://www.windtaskforce.org/profiles/blogs/wind-and-solar-hype-ver...
APPENDIX 1
Wind and Solar Conditions in New England: New England has highly variable weather and low-medium quality wind and solar conditions. See NREL wind map and NREL solar map.
https://www.nrel.gov/gis/images/100m_wind/awstwspd100onoff3-1.jpg
https://www.nrel.gov/gis/images/solar/national_photovoltaic_2009-01...
Wind:
- Wind electricity is zero about 30% of the hours of the year (it takes a wind speed of about 7 mph to start the rotors)
- Wind is minimal most early mornings and most late afternoons/early evenings (peak demand hours), especially during summer
- Wind often is minimal 5 - 7 days in a row in summer and winter, as proven by ISO-NE real-time generation data.
http://www.windtaskforce.org/profiles/blogs/daily-shifting-of-wind-...
- About 60% is generated at night, when demand is much less than during the late afternoons/early evenings
- About 60% is generated in winter.
- During winter, the best wind month is up to 2.5 times the worst summer month
- New England has the lowest capacity factor (about 0.262) of any US region, except the US South. See URL.
https://www.eia.gov/todayinenergy/detail.php?id=20112
Solar:
- Solar electricity is strictly a midday affair.
- It is zero about 65% of the hours of the year, mostly at night.
- It often is minimal 5 - 7 days in a row in summer and in winter, as proven by ISO-NE real-time generation data.
http://www.windtaskforce.org/profiles/blogs/daily-shifting-of-wind-...
- It is minimal early mornings and late afternoons/early evenings
- It is minimal much of the winter months
- It is minimal for several days with snow and ice on most of the panels.
- It varies with variable cloudiness, which would excessively disturb distribution grids with many solar systems, as happens in southern California and southern Germany on a daily basis.
- During summer, the best solar month is up to 4 times the worst winter month; that ratio is 6 in Germany.
- New England has the lowest capacity factor (about 0.145, under ideal conditions) of any region in the US, except some parts of the US Northwest.
NOTE: Even if the NE grid had large capacity connections with Canada and New York, any major NE wind lull and any major NE snowfall likely would affect the entire US northeast, i.e., relying on neighboring grids to "help-out" likely would not be feasible.
Wind Plus Solar:
- Wind plus solar production could be minimal for 5 - 7 days in summer and in winter, with snow and ice on most of the panels, as frequently happens during December, January and February, as proven by ISO-NE real-time generation data.
http://www.windtaskforce.org/profiles/blogs/daily-shifting-of-wind-...
If we were to rely on wind and solar for most of our electricity, massive energy storage systems (GWh-scale for Vermont, TWh-scale for NE) would be required to cover multi-day wind lulls, multi-day overcast/snowy periods, and seasonal variations. See URLs.
http://www.windtaskforce.org/profiles/blogs/wind-and-solar-energy-l...
http://www.windtaskforce.org/profiles/blogs/vermont-example-of-elec...
http://www.windtaskforce.org/profiles/blogs/seasonal-pumped-hydro-s...
http://www.windtaskforce.org/profiles/blogs/electricity-storage-to-...
http://www.windtaskforce.org/profiles/blogs/pumped-storage-hydro-in...
http://www.windtaskforce.org/profiles/blogs/wind-and-solar-hype-ver...
APPENDIX 2
New England Wholesale Electricity Prices: New England wholesale prices have averaged about 5 c/kWh for steady, 24/7/365 electricity since about 2008, primarily due to:
1) Natural gas electricity; 50% of NE generation; low-cost (5 c/kWh), low-CO2 emitting, no particulates, domestic fuel.
2) Nuclear electricity; 26% of NE generation; low-cost (5 c/kWh), minimal-CO2 emitting, no particulates, domestic fuel.
3) NE hydro electricity; 8.4% of generation, low-cost (5 c/kWh), minimal-CO2 emitting, no particulates, domestic.
4) Tie line electricity; 16.7% of NE grid load; low-cost (5.7 c/kWh), minimal-CO2 emitting, no particulates, imported.
APPENDIX 3
High Electricity Prices for RE in New England: The highly subsidized wholesale prices of wind and solar paid by utilities to producers are much higher than in the rest of the US, because of New England’s mediocre wind and solar conditions.
http://www.windtaskforce.org/profiles/blogs/subsidized-solar-system...
Wind and Solar Far From Competitive with Fossil in New England: The Conservation Law Foundation claims renewables are competitive with fossil. Nothing could be further from the truth. Here is a list of NE wholesale prices and Power Purchase Agreement, PPA, prices.
NE field-mounted solar is 12 c/kWh; competitively bid
NE rooftop solar is 18 c/kWh, net-metered; GMP adds costs of 3.813 c/kWh, for a total of 21.813 c/kWh
http://www.windtaskforce.org/profiles/blogs/green-mountain-power-co...
NE wind offshore until recently about 18 c/kWh
NE wind ridgeline is at least 9 c/kWh
DOMESTIC pipeline gas is 5 c/kWh
Russian and Middle East imported LNG is at least 9 c/kWh
NE nuclear is 4.5 c/kWh
NE hydro is 4 c/kWh; about 10 c/kWh, if Standard Offer in Vermont.
Hydro-Quebec imported hydro is 6 - 7 c/kWh; GMP paid 5.549 c/kWh in 2016, under a recent 20-y contract.
NE annual average wholesale price about 5 c/kWh, unchanged since 2009, courtesy of low-cost gas and nuclear.
NOTE: Vineyard Wind, 800 MW, fifteen miles south of Martha’s Vineyard, using 8 or 10 MW turbines, 750 ft tall.
Phase 1 on line in 2021, electricity offered at an average of 8.9 c/kWh over 20 years
Phase 2 offered at an average of 7.9 c/kWh over 20 years
https://www.bostonglobe.com/business/2018/08/13/vineyard-wind-offer...
https://www.boem.gov/What-Does-an-Offshore-Wind-Energy-Facility-Loo...
NOTE: The NE grid is divided in regions, each with Local Market Prices, LMPs, which vary from 2.5 - 3.5 c/kWh from 10 pm to about 6 pm; slowly increase to about 6 - 7 c/kWh around noon time, when solar is maximal; are about 7 - 8 c/kWh in late afternoon/early evening (peak demand hours), when solar is minimal. Unusual circumstances, such as power plant or transmission line outages, can cause LMPs to increase to 20 - 40 c/kWh, and even higher when such events occur during peak demand hours.
NOTE: The above prices would be about 50% higher without the subsidies and even higher without cost shifting. See Appendix.
NOTE: Here is an ISO-NE graph, which shows for very few hours during a 13-y period were wholesale prices higher than 6 c/kWh. Those prices are low because of low-cost gas, low-cost nuclear and low-cost hydro. The last four peaks were due to:
- Pipeline constraints, aggravated by the misguided recalcitrance of pro-RE Governors of NY and MA
- Pre-mature closings of coal and nuclear plants
- Lack of more robust connections to nearby grids, such as New York and Canada. See URLs.
https://www.iso-ne.com/about/key-stats/markets/
http://truenorthreports.com/rolling-blackouts-are-probably-coming-t...
APPENDIX 4
Negotiated Offshore Electricity Cost:
1) The negotiated PPA for the $290 million (plus connection to shore by the utility), 30-MW, 600-ft tall, Block Island Wind project calls for 24.4 c/kWh the first year, increasing at 3.5% per year for 20 years, or 48.6 c/kWh, in the 20th year. This absurdly expensive electricity, which would be about 50% more expensive without subsidies, would be averaged onto the utility’s contracted electricity mix. It is located just 3.1 miles south of Block Island.
https://en.wikipedia.org/wiki/Block_Island_Wind_Farm
2) The negotiated PPA for the $2.6 billion, 468-MW, 600-ft tall, Cape Wind project calls for 18.7 c/kWh the first year, increasing at 3.5% per year for 20 years, or 37.2 c/kWh, in the 20th year. This absurdly expensive electricity, which would be about 50% more expensive without subsidies, would be averaged onto the utility’s contracted electricity mix. Fortunately, it was cancelled, because it was located just a few miles from Hyannis Port, MA.
https://www.bloomberg.com/news/articles/2017-12-01/cape-wind-develo...
APPENDIX 5
Cost Shifting is the Name of the Game: Here is a list of the costs that were shifted, i.e., not charged to wind and solar owners, which make wind and solar appear to be much less costly, than in reality.
Those costs, as c/kWh, could be quantified, but it is politically convenient to charge them to: 1) ratepayers via rate schedules (taxes, fees and surcharges), 2) taxpayers, and 3) federal and state debts.
1) The various forms of inertia (presently provided by gas, coal, oil, nuclear, bio and hydro plants).
2) The filling-in, peaking and balancing by traditional generators due to wind and solar variability/intermittency.
3) Any battery systems to stabilize distribution grids with many solar systems.
4) Any measures to deal with DUCK curves, such as utility-scale storage and demand management
5) Grid-related, such as grid extensions and augmentations to connect and deal with wind and solar. See notes.
6) Utility-scale electricity storage (presently provided by the world’s fuel supply system).
https://www.neon-energie.de/Hirth-2013-Market-Value-Renewables-Sola...
Those items are separate from the high levels of subsidies, which also make wind and solar appear to be much less costly, than in reality. See Appendix.
All that enables RE aficionados to endlessly proclaim: “Wind and solar are competitive with fossil and nuclear”.
NOTE: For example, to bring wind electricity from the Panhandle in west Texas to population centers in east Texas, $7 billion of transmission was built. The entire cost was “socialized”, i.e., a surcharge on residential electric bills.
NOTE: Often the grid connection of offshore wind systems is not included in the capital cost estimates, i.e., it is provided by the utilities that buy the electricity under PPAs. The cost is “socialized”, i.e., a surcharge on residential electric bills.
APPENDIX 6
Massachusetts and Offshore Wind Systems: Massachusetts has a new energy law. The key provision in the 37-page law is a mandate for utilities to solicit long-term contracts with offshore wind system owners to bring at least 1,600 MW (nameplate capacity) into the state by June 2027.
The turnkey capital cost of such wind turbine plants, plus transmission to shore, plus onshore grid modifications, would be at least $9 billion, and the electricity cost would be at least 16 - 18 c/kWh. See URL.
In addition, utilities would also be required to solicit contracts for up to 1,200 additional MW of clean energy generation that could include a mix of hydro, onshore wind and solar.
NOTE: New England wholesale prices have averaged about 5 c/kWh for steady, 24/7/365 electricity since about 2008, primarily due to:
- Natural gas electricity; 50% of NE generation, low-cost (5 c/kWh), low-CO2 emitting, clean (no particulates), domestic fuel
- Nuclear electricity; 26% of NE generation, low-cost (5 c/kWh), low-CO2 emitting, clean (no particulates), domestic fuel
Construction would require huge sea-going tugs, cranes and other specialized vessels to assemble those 600-ft tall wind turbines. Europe has perfected that equipment, but the US does not even have it. Europe offshore wind capacity is 12,900 MW, versus the US 30 MW at end 2017.
European companies, such as Vestas and DONG of Denmark, Siemens of Germany, etc., will make big profits. Wall Street banks will make loans, and financial managers will collect fees for managing the tax shelters for the multi-millionaire investors. New England ratepayers will pay for the outrageously high cost of electricity.
Just another way for EU, etc., to hamstring the New England and US economy into higher cost structures and make them less competitive, all under the false flag of fighting global warming, and saving the world. See URLs.
The US has plenty of domestic low-cost energy. It does not need to build expensive offshore wind systems.
The EU imports most of its energy. It has to build expensive offshore wind systems.
The EU likely thinks, if the US does not follow the EU into high-cost renewable energy, the US would have a competitive advantage, and attract energy-intensive businesses, which must be avoided at all costs.
https://www.washingtonpost.com/news/energy-environment/wp/2016/08/0...
http://www.windtaskforce.org/profiles/blogs/a-very-expensive-offsho...
http://www.windtaskforce.org/profiles/blogs/the-eu-and-internationa...
APPENDIX 7
Plant Closures and Economics and Politics
http://www.windtaskforce.org/profiles/blogs/a-likely-scenario-durin...
http://www.windtaskforce.org/profiles/blogs/wind-and-solar-hype-ver...
Since 2010, California closed one nuclear plant (2,140 MW) and Germany closed 5 nuclear plants and 4 other reactors at currently operating plants (10,980 MW in total). Those closures were due to political pressures by RE aficionados, who also pressure to close “dirty” coal plants.
Wind and solar owners are allowed to feed their heavily subsidized electricity into the grid regardless of whether it is needed or not, and, usually, they get paid atabove wholesale feed-in tariff rates, or at above wholesale power purchase agreement, PPA, rates; a “no lose” deal for those owners, paid for by everyone else (subsidies, cost shifting, higher prices for goods and services).
However, nuclear and coal plant owners usually get paid at wholesale prices, which have been decreasing due to the combination of 1) increased, heavily subsidized wind and solar, and 2) increased generation with low cost gas.
Remember, variable and intermittent wind and solar electricity cannot exist on any electric grid without the traditional, dispatchable, flexible, generators, primarily gas turbine plants, performing the peaking, filling-in and balancing. So it is only natural the owners of wind and solar plants and the owners of gas plants having political coalitions to promote their own agendas, which include the closures of coal and nuclear plants.
However, the US national security sector relies on the US electrical sector for 99% of its electricity. It is of vital importance for the US to have a large capacity of power plants, with large, onsite fuel storage, such as coal and nuclear plants, to ensure electricity service at a reliability of 99.97% or better, 24/7/365. Having just wind and solar, plus gas plants would greatly diminish the ensuringof that reliability.
APPENDIX 8
LNG Deliveries to Everett, MA During 2017/2018 Gas Shortage
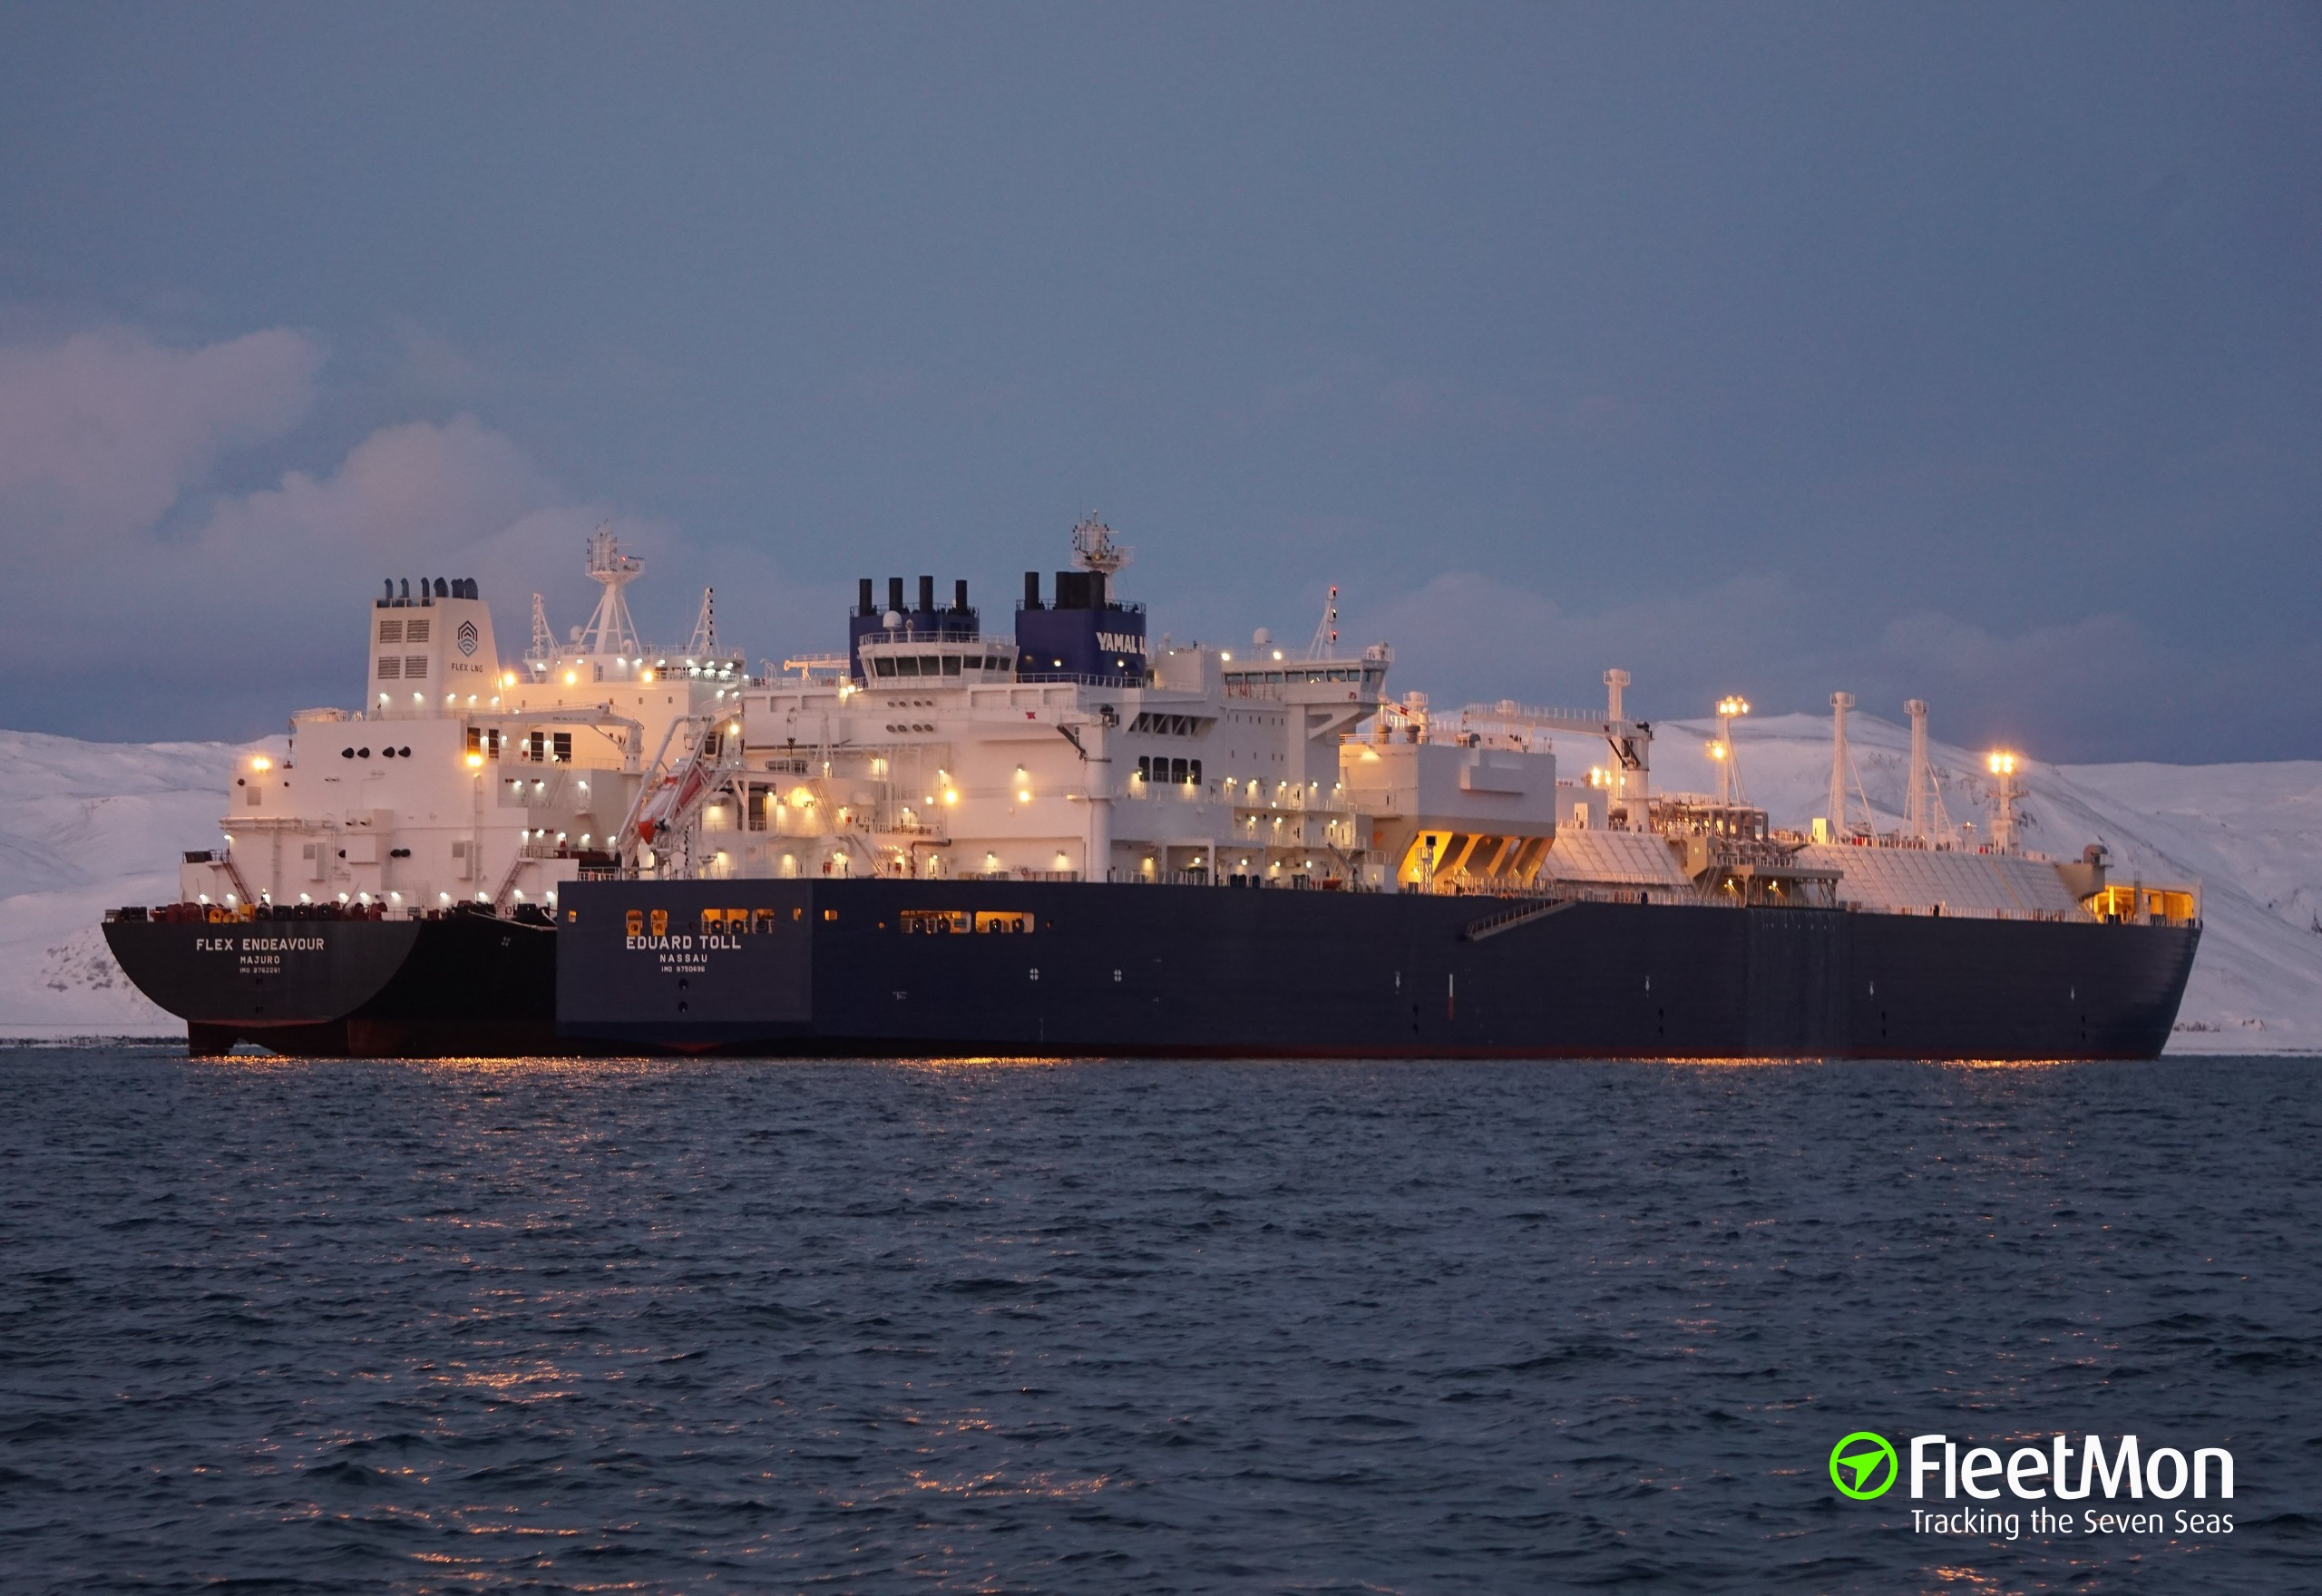
Delivering the LNG: The Christophe de Margerie, a Russian-owned icebreaking tanker, named after the deceased former CEO of Total, motored into Isle de Grain, UK, on Dec. 28, according to market information provider ICIS. It unloaded LNG from the new Yamal gas/oil plant in Russia. See URLs and Note.
https://www.reuters.com/article/lng-yamal-shipping/table-arc7-class...
https://photos.fleetmon.com/vessels/eduard-toll_9750696_2272589_XLa...
https://www.vesselfinder.com/?p=2511
The Gaselys, a French-owned tanker, arrived at Isle de Grain, UK, which is a large LNG storage facility in the UK that receives gas from many sources, including the Netherlands, Norway, Middle East, Russia, etc.
It took on a cargo of commingled LNG, including LNG from the Christophe de Margerie. See Note.
It left the port on Jan. 7
It arrived at the ENGIE terminal (owned by a French company) in Everett, Mass., three weeks later and delivered its payload.
Both tankers were built in Korea.
Everett LNG storage is 3.4 bcf, peak delivery 1 bcf, maximum continuous delivery 0.715 bcf.
Average LNG density = 450 kg/m3 x 0.62428 = 28.1 lb/ft3, depends on gas composition and temperature.
GDF Suez Gaz NA, a French company, owns the LNG plants in Trinidad and Tobago that supply most of the LNG to Everett.
It is amazing how much of the LNG infrastructure, and LNG storage plants, and LNG fleets are built and owned by foreigners! See URL.
http://www.windtaskforce.org/profiles/blogs/the-eu-and-internationa...
https://www.eenews.net/stories/1060076897
http://www.powermag.com/everett-lng-terminal-at-the-crossroads/?pag...
https://www.linkedin.com/pulse/lng-terms-tonsyear-cubic-meters-btus...
NOTE: Shipments of Russian oil and gas are not subject to sanctions, but “US persons and those in the US” are prohibited from financing Novatek, the lead company in the construction of Yamal LNG. The French, our friendly trading partner, took advantage of that.
- Yamal LNG; operated by Yamal LNG company; owned by Russian independent gas producer Novatek (50.1%), Total, a French company (20%), CNPC (20%) and Silk Road Fund (9.9%); capital cost $27 billion; capacity 16.5 million mt LNG, 3 trains.
- Yamal LNG 2: operated by Yamal LNG company; owned by Novatek (60%), Total (20%); Others (20%); capital cost $25.5 billion; capacity 19.8 million mt LNG, 3 trains.
https://www.ft.com/content/56f19604-fd6d-11e7-a492-2c9be7f3120a
https://www.bloomberg.com/news/articles/2017-12-14/russia-dreams-bi...
https://www.total.com/en/media/news/press-releases/yamal-lng-projec...
APPENDIX 9
Traditional
Nuclear Plants with Flexible Outputs: In 2017, about 30.8 % of NE generation was from nuclear. Their CO2/kWh is minimal. France been ramping their nuclear plants up and down in a daily basis for decades. France has at least 75% of their electricity from nuclear and has one of the lowest household electric rates in Europe. Denmark and Germany, with high levels of wind and solar, have the highest rates by far.
Combined Cycle Gas Turbine Plants with Flexible Outputs: In 2017, about 48% of NE generation was from pipeline gas. Their CO2/kWh is about 1/3 of coal. CCGT plants can be ramped from about 50% to 100% of rated output. Below 50%, they become unstable. Increased: 1) ramping, 2) hot synchronous standby, and 3) starts and stops, is less efficient (more Btu/kWh, more CO2/kWh). If imported liquefied natural gas, LNG, were used, such as from Russia, the Middle East, etc., the wholesale prices of that portion of generation would increase from 5 c/kWh to at least 10 c/kWh.
Hydro Plants with Flexible Outputs: In 2017, about 8.4% of NE generation was from hydro plants. Their CO2/kWh is minimal. Hydro plants can be ramped from about 10% to 100% of rated output. They are ideal for providing peaking, filling-in and balancing services to offset similar variations in the outputs of wind and solar.
Coal Plants with Flexible Outputs: In 2017, less than 2% of NE generation was from coal. Coal plants usually are operated near rated outputs, because that is most economic and produces the lowest cost/kWh. Their CO2/kWh is about 2/3 of wood-chip power plant. Coal plants can be ramped from about 50% to 100% of rated output. Below 50%, they become unstable. Wet scrubbing air pollution control systems need steady flue gas flows to maintain chemical balances for high efficiency.
Renewable
Renewables include wind, solar, wood, landfill methane. In 2017, about 10.6% of NE generation was from renewables. This level was reached due to very high subsidies for at least 10 years.
Views: 144
Comment
Maine as Third World Country:
CMP Transmission Rate Skyrockets 19.6% Due to Wind Power
Click here to read how the Maine ratepayer has been sold down the river by the Angus King cabal.
Maine Center For Public Interest Reporting – Three Part Series: A CRITICAL LOOK AT MAINE’S WIND ACT
******** IF LINKS BELOW DON'T WORK, GOOGLE THEM*********
(excerpts) From Part 1 – On Maine’s Wind Law “Once the committee passed the wind energy bill on to the full House and Senate, lawmakers there didn’t even debate it. They passed it unanimously and with no discussion. House Majority Leader Hannah Pingree, a Democrat from North Haven, says legislators probably didn’t know how many turbines would be constructed in Maine if the law’s goals were met." . – Maine Center for Public Interest Reporting, August 2010 https://www.pinetreewatchdog.org/wind-power-bandwagon-hits-bumps-in-the-road-3/From Part 2 – On Wind and Oil Yet using wind energy doesn’t lower dependence on imported foreign oil. That’s because the majority of imported oil in Maine is used for heating and transportation. And switching our dependence from foreign oil to Maine-produced electricity isn’t likely to happen very soon, says Bartlett. “Right now, people can’t switch to electric cars and heating – if they did, we’d be in trouble.” So was one of the fundamental premises of the task force false, or at least misleading?" https://www.pinetreewatchdog.org/wind-swept-task-force-set-the-rules/From Part 3 – On Wind-Required New Transmission Lines Finally, the building of enormous, high-voltage transmission lines that the regional electricity system operator says are required to move substantial amounts of wind power to markets south of Maine was never even discussed by the task force – an omission that Mills said will come to haunt the state.“If you try to put 2,500 or 3,000 megawatts in northern or eastern Maine – oh, my god, try to build the transmission!” said Mills. “It’s not just the towers, it’s the lines – that’s when I begin to think that the goal is a little farfetched.” https://www.pinetreewatchdog.org/flaws-in-bill-like-skating-with-dull-skates/
Not yet a member?
Sign up today and lend your voice and presence to the steadily rising tide that will soon sweep the scourge of useless and wretched turbines from our beloved Maine countryside. For many of us, our little pieces of paradise have been hard won. Did the carpetbaggers think they could simply steal them from us?
We have the facts on our side. We have the truth on our side. All we need now is YOU.
“First they ignore you, then they laugh at you, then they fight you, then you win.”
-- Mahatma Gandhi
"It's not whether you get knocked down: it's whether you get up."
Vince Lombardi
Task Force membership is free. Please sign up today!
Hannah Pingree on the Maine expedited wind law
Hannah Pingree - Director of Maine's Office of Innovation and the Future
"Once the committee passed the wind energy bill on to the full House and Senate, lawmakers there didn’t even debate it. They passed it unanimously and with no discussion. House Majority Leader Hannah Pingree, a Democrat from North Haven, says legislators probably didn’t know how many turbines would be constructed in Maine."
https://pinetreewatch.org/wind-power-bandwagon-hits-bumps-in-the-road-3/
© 2026 Created by Webmaster.
Powered by
![]()
You need to be a member of Citizens' Task Force on Wind Power - Maine to add comments!
Join Citizens' Task Force on Wind Power - Maine