Trump pledges to “terminate every Green New Deal restriction that is destroying the U.S. economy" (Full video of SD speech)
Trump Slams Biden’s Electric Vehicle Agenda: ‘They Will All Be Made in China’
by Nick Gilbertson 8 Sep 2023
Former President Donald Trump slammed President Joe Biden’s electric vehicle mandate proposal as “preposterous” and said it would benefit China and destroy the American auto industry, according to prepared remarks circulated by his campaign ahead of his speech in Rapid City, South Dakota.
In the speech, Trump pledges to “terminate every Green New Deal restriction that is destroying the U.S. economy with skyrocketing energy costs—starting with Biden’s preposterous Electric Vehicle mandate.”
Biden’s Environmental Protection Agency (EPA) has proposed regulations that would require as much as two-thirds of the new U.S. car market to be electric vehicles by 2032.
Twenty Republican attorneys general signed a letter in July slamming the agenda aimed at new light-duty electric vehicles, writing it jeopardizes “consumer safety, economic stability, and national security.”
Trump notes in his speech that United Auto Workers President Shawn Fain “cannot even think about allowing all-electric cars – they will all be made in China, and the Auto Industry in America will cease to exist!”
“There is already a giant ‘E Glut,” they don’t go far or long, are very expensive, and the consumer must be given a choice. Vote for Trump, and I will stop this madness immediately,” he adds.
Full article at the following weblink:
https://www.breitbart.com/2024-election/2023/09/08/trump-slams-bide...
Trump South Dakota speech 9/8/23
Scroll to the 4 hour and 23 minute mark for President Trump.
LIVE: President Donald J. Trump Visits Rapid City, South Dakota - S...
Views: 80
Comment
-
Comment by Willem Post on September 11, 2023 at 6:06pm
-
The Indian footprint is all over the G20 statement
India reinforces the opinions of the African and South American nationsBRISC+6, soon BRISC+12, includes two nuclear superpowers and two fossil superpowers
The BRISC folks in Africa, etc., have no intention of following the EU/US into the renewables money pit, and enslaving/indebting themselves again, with the EU/EU owning the technologies and infrastructures, and printing the money.
The BRISC folks want to GROW their GDPs with abundant, good-old-reliable, low-cost fossil
China gets about 52% of all its energy from coal, or 82% from fossil
The U.S. gets about 15% of all is energy from coal, or 80% from fossilThe US and China get about 80% of their total energy from fossil.
https://ourworldindata.org/grapher/energy-consumption-by-source-and...
2022
US
US
China
China
Source
TWh
%
TWh
%
Other
224
0.84
530
1.21
Bio
424
1.59
28
0.06
Solar
538
2.02
856
1.95
Wind
1145
4.30
1716
3.91
Hydro
674
2.53
3402
7.75
Nuclear
2032
7.63
1023
2.33
Gas
8812
33.09
3803
8.67
Coal
2741
10.29
24315
55.42
Oil
10042
37.71
8201
18.69
Total
26632
100.00
43874
100.00
Fossil
21595
81.09
36319
82.78
-
-
The European Big Wind industry, drowning in RED INK, is finally telling the UK idiot bureaucrats, ENOUGH IS ENOUGH
Paris is “off course”, because it was, and still is, built on a lie;
many NATURAL forces cause the observed global temperature changes, already for 4 billion yearsThe increase in interest rates, long overdue, due to excessive printing of money, plus increased inflation, and increased energy costs, and increased materials cost, and increased skilled labor costs, and increased supply chain bottlenecks (lack of specialized ships) have combined to increase the capital cost per MW of installed wind/solar/battery capacity by about 70%, according to Bloomberg.
People are finally beginning to realize, the costs of Paris are astronomical, and even the richest countries on the planet cannot afford it going forward.
This gave rise to BRISC+6, soon BRISC+12, including two nuclear superpowers, and two oil superpowers, which will represent about 60% of the world population, and will control the majority of the world’s resources.
Oil is at $95/barrel, as decided by Russia and SaudiArabia .
The US Strategic Oil Reserve is empty, due to the flawless “political executive planning” of the illegitimate/grifting/grafting, Biden in-the-basement
BRISC does no longer want its resources used for the West to play world domination and climate fantasy games
It is curtains for the US/EU, Paris, and the arbitrary imposing of its self-serving, rules-based, bull manure
No Offshore Wind bids for the 5th Auction in the UK in 2023, because UK bureaucrats, ignoring market conditions, offered subsidies that are at least 40% TOO LOW, per Vattenfall.
Read these two articles to get up to speed
BATTERY SYSTEM CAPITAL COSTS, OPERATING COSTS, ENERGY LOSSES, AND AGING
https://www.windtaskforce.org/profiles/blogs/battery-system-capital...US/UK 56,000 MW OF OFFSHORE WIND BY 2030; AN EXPENSIVE FANTASY
https://www.windtaskforce.org/profiles/blogs/biden-30-000-mw-of-off...
-
-
BATTERY SYSTEM CAPITAL COSTS, OPERATING COSTS, ENERGY LOSSES, AND AGING
https://www.windtaskforce.org/profiles/blogs/battery-system-capital...
Solar electricity increases with the rising sun, is maximal around midday, and decreases with the setting sun.
Electric grids with many solar systems have major midday solar output bulges, that are counteracted/balanced by traditional power plants reducing their outputs. Combined-cycle, gas-turbine plants, CCGTs, perform almost all of the counteracting/balancing of the variable wind and solar outputs.
Those plants have to increase their outputs during the peak hours of late afternoon/early evening, when solar and wind usually are minimal; solar will have gone to sleep until about 9 AM the next morning.
Owners of counteracting/balancing plants, to avoid grid overload, are required by ISO-NE, the NE grid operator, to counteract the midday solar bulge, i.e., reduce their outputs, which decreases their annual production, kWh/y, increases their costs, c/kWh, plus increases wear and tear of their plants.
ISO-NE compensates the Owners of these plants, and charges utilities as part of “grid charges”, plus mark-up.
The utilities charge ratepayers, plus mark-up. Nothing is “for free”
Battery Systems Electricity Delivery Periods at Rated Capacity
Battery systems have rated capacity outputs, MW, and rated energy delivery, MWh. Most recently installed battery systems have about 4 hours of electricity delivery, MWh, at rated capacity, MW, because those battery systems are primarily used to absorb midday solar output bulges.
Battery systems, in use during all of 2015, delivered electricity, on average, for 0.5 hours
Battery systems, in use during all of 2018, delivered electricity, on average, for 2.4 hours
Battery systems, in use during all of 2019, delivered electricity, on average, for 3.2 hours
The increase in energy-delivery duration is required, because the main function of battery systems is to store excess wind and midday solar output bulges. They discharge about 80% of the stored electricity during the peak hours of late afternoon/early evening; the other 20% are round-trip battery system losses.
https://www.eia.gov/todayinenergy/detail.php?id=43775
Battery Systems Perform Multiple Services at the Same Time
A 2018 survey of 43 battery systems, performed by the Energy Information Administration, EIA, found:
26 systems dealt with: 1) excess wind events, which occur at random, and 2) midday solar output bulges, which occur every day
18 dealt with frequency regulation
13 dealt with system peak demand shaving
The annual battery throughput is greatest, by far, for dealing with excess wind and midday solar output bulges.
.
.
Round-Trip Losses of Battery Systems
Because of round-trip losses, batteries are a net consumer of electricity. Of the 150 battery plants (1,022 MW) that reported operating battery storage capacity on Form EIA-860 in 2019, 109 plants (850 MW) also reported electricity discharge and charge data on Form EIA-923 in 2019.
These 109 plants, using a mix of storage technologies, including li-ion, reported a gross discharge of 458,169 MWh, and a gross charge of 553,705 MWh, in 2019; for an average AC-to-AC round-trip loss of 20.85%, as measured from inlet to front-end power electronics, through battery, to outlet of back-end power electronics.
Losses of various storage technologies range from about 35% to less than 20%, for an average of 20.85%; that average has decreased, due to the increased use of li-ion batteries.
The 20.85% excludes electricity consumption of: 1) thermal management of batteries and enclosures, 2) control and monitoring, 3) step-up and step-down transformers, 4) site lighting, O&M, surveillance.
That electricity often is not reported. It may be measured by separate meters.
NOTE: Li-ion battery systems, because of mass production by Tesla and others, have lesser costs per kWh delivered as AC, and lesser percent losses relative to other technologies.
Since about 2017, li-ion systems have become a major part of the US storage system inventory. See Part 4
Battery System Usage Usually Less than 10%
Usage is the percent of rated energy delivery, MWh. The highest usage level is:
1) Charging when wholesale prices are low and discharging when they are high, so-called arbitrage,
2) Charging during midday, when solar output surges, and discharging during the peak hours of late afternoon/early evening.
Here are some EIA examples:
1) About 230,000 MWh of the gross discharge in the PJM area was for frequency regulation (Figure 10 in URL).
The PJM battery systems have a usage factor of almost 9%
2) About 110,000 MWh of the gross discharge in the CAISO area was for excess wind and solar storage.
The CAISO battery systems have a usage factor of just over 9%
3) The ISO-NE battery systems have a usage factor of about 5%
See page 20 of URL
https://www.eia.gov/analysis/studies/electricity/batterystorage/pdf...
Multi-day Wind/Solar Lulls
If, at some future date, gas, oil, and nuclear power plants were no longer allowed, and were replaced by wind and solar systems, battery systems would need about a month of electricity delivery to cover:
1) Randomly occurring, 5 to 7-day wind/solar lulls, with mostly minimal output, could be followed by another multi-day wind/solar lull a few days later.
The battery systems would be near empty after counteracting the first lull, and likely would not be recharged by wind/solar in a timely manner, to counteract the second lull.2) Seasonal wind/solar output variations
3) Year-to-year wind/solar output variations of 25 - 30%.
NOTE: The German ENERGIEWENDE target is 80 - 95% of electricity generation from renewables by 2050.
Germany uses 1) connections to nearby grids, 2) fossil fuel standby/backup plants for counteracting/balancing most of its wind and solar, especially during sunny and windy days. Large-scale battery storage is deemed too expensive. See URLs.
https://www.thegwpf.org/content/uploads/2017/01/Vahrenholt-Energiew...
https://www.windtaskforce.org/profiles/blog/list?user=0fk5o2ukdpq69
US Utilities Hiding Capital and Operating Cost Data
US Utilities, which own a large number of various technology battery systems, publicize a minimum amount of year-by-year spreadsheet information regarding the:
1) All-in, turnkey capital cost of their battery systems
2) Hourly and daily operating data, including all-in, round-trip losses, and usage for each service.
3) Revenues earned from each service
4) Annual cost of: 1) owner’s income, 2) cost of financing, 3) O&M expenses, 4) all other expenses
5) How much of Owner annual costs is offset by tax credits, depreciation of the entire system in about 5 years, and deduction of interest.
PART 1
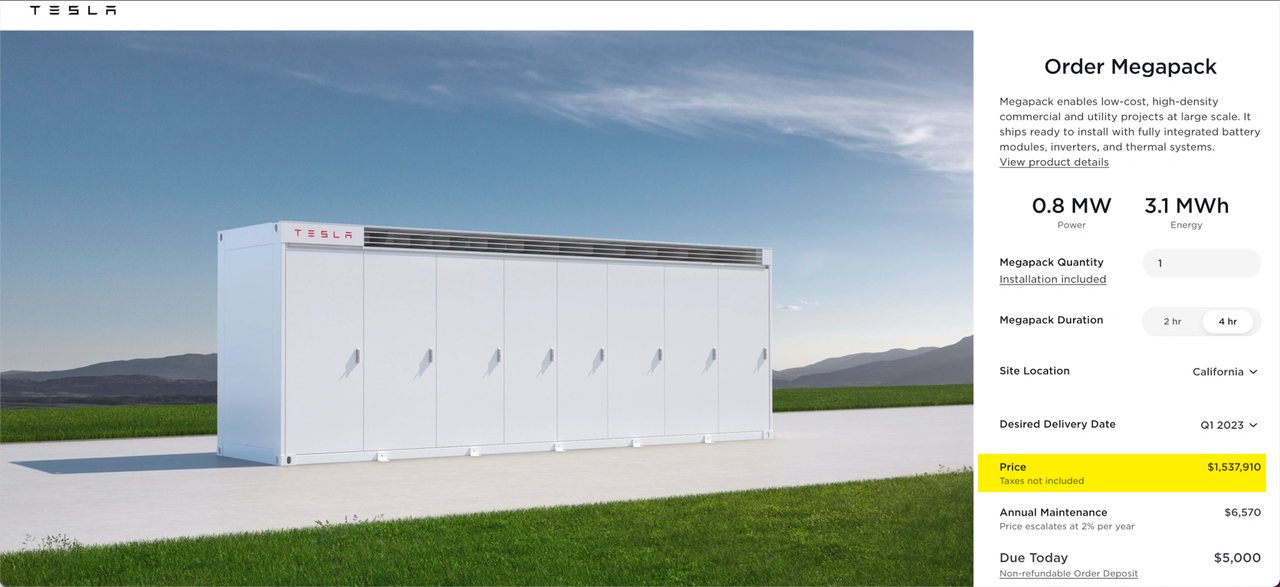
Turnkey Capital Cost of Tesla-Megapack Battery Systems
Tesla is the world’s largest provider of lithium-ion battery systems, that include front-end power electronics, batteries, back-end power electronics, heating and cooling systems for batteries and enclosures
Megapack ratings, MW/MWh, increased from 2021, to 2022, to 2023
Megapack pricing varies due to market conditions
2021 pricing for a 10 Megapack system, 4-h delivery, with installation, about $10 million, or $328/kWh
2022 pricing for a 10 Megapack system, 4-h delivery, with installation, about $16 million, or $412/kWh
2023 pricing for a 10 Megapack system, 4-h delivery, with installation, about $19 million, or $487/kWh
Tesla Megapacks had a 487/328 = 48.5% price increase from 2021 to 2023
Connecting the Megapacks into a system incurs losses, which are represented by the “Tesla design factor”
After applying the factor, the above $/kWh is increased! See URLs and below examples.
https://electrek.co/2022/03/21/tesla-hikes-megapack-prices-backlog-...
https://www.tesla.com/megapack/design
1) Example of Turnkey Cost of Large-Scale, Megapack Battery System, based on 2022 pricing
PG&E, a California utility, placed a battery system in operation at Moss Landing in April 2022
The system consists of 256 Megapacks, rated at 182.5 MW/730 MWh, 4-h energy delivery.
Power = 256 Megapacks x 0.770 MW x 0.926, Tesla design factor = 182.5 MW
Energy = 256 Megapacks x 3.070 MWh x 0.929, Tesla design factor = 730 MWh
We assume $1.1 million/Megapack, because of large number of units
Estimated supply by Tesla is 256 Megapacks x $1.1 million = $282 million, or $386/kWh
Estimated supply by Ohers is $62/kWh
All-in, turnkey cost about $448/kWh; 2022 pricing
The primary purpose of this battery system is to absorb midday solar output bulges, and deliver about 80% of it during the peak demand hours of late afternoon/early evening.
Any costs associated with battery systems are charged to ratepayers, taxpayers and added to government debt, i.e., not charged to Owners of solar systems, the grid disturbers.
https://www.10news.com/news/national/pg-es-tesla-megapack-battery-i...
2) Example of Turnkey Cost of Large-Scale, Megapack Battery System, based on 2023 pricing
The system consists of 50 Megapack 2, rated at 45.3 MW/181.9 MWh, 4-h energy delivery
Power = 50 Megapacks x 0.979 MW x 0.926, Tesla design factor = 45.3 MW
Energy = 50 Megapacks x 3.916 MWh x 0.929, Tesla design factor = 181.9 MWh
Estimate of supply by Tesla is $90 million, or $495/kWh. See URL
Estimate of supply by Others is $14.5 million, or $80/kWh
All-in, turnkey cost about $575/kWh; 2023 pricing
https://www.tesla.com/megapack/design
https://cms.zerohedge.com/s3/files/inline-images/2022-03-21_15-28-4...
https://www.zerohedge.com/commodities/tesla-hikes-megapack-prices-c...
Fixed Annual Cost of Megapack Battery Systems
Assume a system rated at 45.3 MW/181.9 MWh, and an all-in turnkey cost of $104.5 million, per above Example 2
Amortizing a bank loan for 50% of $104.5 million at 6%/y for 15 years will cost $5.291 million/y
Paying the Owner for his investment of 50% of $104.5 million at 9%/y for 15 years will cost $6.359 million/y (9% because of high inflation)
Lifetime (Bank + Owner) payments 15 x (5.291 + 6.359) = $174.75 million
Assume battery daily usage for 15 years is 10%, and losses of 20%
To HV grid is 15 y x 365 d/y x 181.9 MWh x 0.1, usage= 99,590,250 kWh
From HV grid to charge battery, 124,487,813 kWh
Loss, 24,897,563 kWh
(Bank + Owner) payments is $174.75 million / 99,590,250 kWh = 175.5 c/kWh
Cost of loss is 24,897,563 kWh x 6 c/kWh, assumed = $1,493,854, or $1,493,854 / 99,590,250 kWh = 1.5 c/kWh
Total cost is 175.5 + 1.5 = 177 c/kWh
Less subsidies at 50% (tax credits, depreciation in 5 years, deduction of interest on borrowed funds) is 88.5 c/kWh
At 10% usage, publicized cost would be 88.5 c/kWh
At 40% usage, publicized cost would be 22.7 c/kWh
Excluded costs/kWh: 1) O&M; 2) system aging, 3) in year 15, decommissioning, i.e., disassembly, reprocessing and storing at hazardous waste sites.
NOTE 1: The 40% usage is close to Tesla’s recommendation of 60% usage, i.e., not charging in excess of 80% and not discharging to less than 20%,
Tesla’s recommendation was not heeded be Hornsdale Power Reserve owners.
They added Megapacks to offset rapid aging of the original system and to increase the rating of the expanded system.
http://www.windtaskforce.org/profiles/blogs/the-hornsdale-power-res...
NOTE 2: After looking at several aerial photos of large-scale battery systems with many Megapacks, it is clear many other items of equipment are shown, other than the Tesla supply, such as step-down/step-up transformers, switchgear, connections to the grid, land, access roads, fencing, security, site lighting, i.e., the cost of the Tesla supply is only one part of the battery system cost at a site.
NOTE 3: Battery system turnkey capital costs and electricity storage costs likely will be much higher in 2023 and future years, than in 2021 and earlier years, due to: 1) increased inflation rates, 2) increased interest rates, 3) supply chain disruptions, which delay projects and increase costs, 4) increased energy prices, such as of oil, gas, coal, electricity, etc., 5) increased materials prices, such as of tungsten, cobalt, lithium, copper, manganese, etc., 6) increased labor rates.
NOTE 4: World cobalt production was 142,000 and 170,000 metric ton, in 2020 and 2021, respectively, of which the Democratic Republic of the Congo was 120,000 metric ton in 2021.
https://www.kitco.com/news/2022-02-02/Global-cobalt-production-hits...
https://www.wilsoncenter.org/blog-post/drc-mining-industry-child-la...
-
-
US/UK 56,000 MW OF OFFSHORE WIND BY 2030; AN EXPENSIVE FANTASY
https://www.windtaskforce.org/profiles/blogs/biden-30-000-mw-of-off...
The US government has the insane fantasy of wanting to build 30,000 MW of offshore by 2030, i.e., just 7 years, but several companies, building projects for Massachusetts, will be allowed to walk away from the signed PPAs, and rebid at much higher prices next year.
The UK government has the insane fantasy of wanting to build 26,000 MW of offshore by 2030, i.e., in just 7 years,
The continent-based European big wind companies have only one third of the capacity per year for building 56,000 MW offshore by 2030, or 8,000 MW/y. These companies will concentrate on the U.S. market, because the Biden "Inflation-Reduction-Act” subsidies are about much higher than in the UK
1) Vattenfall, Sweden, has put 1,400 MW on hold in 2023 (will re-evaluate its entire 4,200 MW zone), because Vattenfall spreadsheets show a “net revenue shortage” of about 40%, meaning the prices, c/kWh, offered by the UK auctions are about 40% too low.
https://www.offshorewind.biz/2023/07/20/breaking-vattenfall-stops-d....
About 7,000 MW of offshore wind bids were rewarded by the UK 4th Auction, in 2022
Zero MW of offshore wind bids were submitted for the UK 5th Auction, in 2023
2) OERSTED, Denmark, is looking forward to a $2.6 billion loss on its three US East Cost offshore wind systems, mainly due to high inflation, high interest rates, supply chain disruptions, and not being awarded additional federal and state tax credits. Oersted, etc., urges Biden to ignore the domestic content requirements of the Inflation Reduction Act, so 100% of the wind turbines will be very expensively built in Europe, with US subsidies.
https://www.reuters.com/business/energy/denmarks-orsted-anticipates...
3) New York State bureaucrats calculated their estimates of offshore wind contract prices, but when the owners saw those numbers, they said, we need up to 66% more, for OUR spreadsheets to make sense. See Item 4 and note
Oersted, Denmark, Sunrise wind, original price $110.37/MWh, needs $139.99/ MWh, a 27% increase
Equinor, Norway, Empire 1 wind, original price $118.38/MWh, needs $159.64/MWh, a 35% increase
Equinor, Norway, Empire 2 wind, original price $107.50/MWh, needs $177.84/MWh, a 66% increase
Equinor, Norway, Beacon Wind, original price $118.00/MWh, needs $190.82/ MWh, a 62% increase
https://www.windtaskforce.org/profiles/blogs/liars-lies-exposed-as-...
4)
Lifetime Performance of World’s First Offshore Wind Farm
https://www.windtaskforce.org/profiles/blogs/lifetime-performance-o...
IRENA, a European Renewables Proponent, Ignores the Actual Cost Data for Offshore Wind Systems in the UK
https://www.windtaskforce.org/profiles/blogs/irena-a-european-renew...
NOTE: “The all-in, turnkey capital cost associated with a typical US offshore project, before bonus tax credits related to the "Inflation-Reduction-Act", has increased by 57% since 2021. Increased costs of materials, energy, components, labor, and supply chain constrains and disruptions explain about 40% of that, with 60% due to increased interest rates.”, per Bloomberg recently reported, citing figures from Bloomberg-NEF.
Part 1
BIDEN 30,000 MW OF OFFSHORE WIND BY 2030; AN EXPENSIVE FANTASY
https://www.windtaskforce.org/profiles/blogs/biden-30-000-mw-of-off...
The Biden administration announced on October 13, 2021, it will subsidize the development of up to seven offshore wind systems (never call them farms) on the US East and West coasts, and in the Gulf of Mexico; a total of about 30,000 MW of offshore wind by 2030.
This is part of the “Inflation Reduction Act”, which CBO estimated at $391 billion, but Goldman Sachs estimated at $1.2 trillion, due to Biden’s handlers “liberally interpreting” the various open-ended measures.
This deficit spending will be added to the national debt, which would increase inflation. See URL for explanation.
https://www.windtaskforce.org/profiles/blogs/biden-s-green-energy-p...
Biden's offshore wind systems would have an adverse, long-term impact on US electricity wholesale prices, and the prices of all other goods and services, because their expensive electricity would permeate into all economic activities.
The wind turbines would be at least 800-ft-tall, which would need to be located at least 30 miles from shores, to ensure minimal disturbance from night-time strobe lights.
Any commercial fishing areas would be significantly impacted by below-water infrastructures and cables. The low-frequency noise (less than 20 cycles per second, aka infrasound) of the wind turbines would adversely affect marine life, including whales, and productivity of fishing areas.
https://www.windtaskforce.org/profiles/blogs/feds-finally-admits-of...
Offshore Wind Electricity Production and Cost
Electricity production would be about 30,000 MW x 8766 h/y x 0.45, capacity factor = 118,341,000 MWh, or 118.3 TWh
The additional wind production would be about 100 x 118.3/4000 = 2.96% of the annual electricity loaded onto US grids.
The US grid load would increase, due to tens of millions of future electric vehicles and heat pumps.
Electricity Cost: Assume an offshore project consists of wind turbines and cabling to shore at $5,000/kW; lifetime CF = 0.45
- Amortizing bank loan for 50% of the project at 6.25%/y for 20 years, 5.559 c/kWh.
- Paying Owner investment of 50% of the project at 9%/y for 20 years, is 6.843 c/kWh (9% because of high inflation).
- Offshore O&M, about 30 miles out to sea, 8 c/kWh.
- All other items, 4 c/kWh
- Total cost 5.56 + 6.84 + 8 + 4 = 24.40 c/kWh
- Less 50% subsidies (tax credits, depreciation in 5 years, interest deduction on borrowed funds) 12.20 c/kWh
- Owner sells to utility at 12.20 c/kWh
Not included:
- Levelized cost of onshore grid expansion/augmentation, about 2 c/kWh
- Levelized cost of curtailment/counteracting/balancing, 24/7/365, about 2 c/kWh
- Levelized cost of decommissioning, i.e., disassembly at sea, reprocessing and storing at hazardous waste sites
Floating offshore wind, as in Maine and California offshore, would be about $7,000 - $8,000 per MW. Payments for Amortizing bank loan, Owner return, O&M, and All other items would be higher, and the c/kWh would be higher than grounded offshore wind.
The various subsidies, added to national debt, would be higher.
NOTE: If li-ion battery systems were contemplated, they would add 20 to 40 c/kWh to the cost of any electricity passing through them, during their about 15-y useful service lives! See Part 1 of URL
https://www.windtaskforce.org/profiles/blogs/battery-system-capital...Five major items, usually not mentioned by wind/solar proponents
1) Cost Shifting; the Name of the Game
The shifted costs and subsidies would result in:
1) Increased tax burdens on taxpayers
2) Increased household electric rates on ratepayers
3) Additions to federal and state government debts.
4) Additional burdens on the owners of traditional generators, because their power plants have to counteract the wind output variations, 24/7/365; the more wind (and solar), the greater the electricity quantities, MWh, involved in the counteracting, plus their plants have to spend more time on hot and cold standby, and are required to have more-frequent start/stops. See URLs and Appendix
https://www.windtaskforce.org/profiles/blogs/grid-balancing-costs-s...
http://www.windtaskforce.org/profiles/blogs/cost-shifting-is-the-na...
NOTE: These rates compare with the average New England wholesale price of about 5 c/kWh, during the 2009 - 2022 period, 13 years, courtesy of:
1) Abundant, domestic, natural gas-fueled CCGT plants, that have low-cost/kWh, low-CO2/kWh, extremely-low particulate/kWh
2) Domestic, uranium-fueled nuclear plants, that have low-cost/kWh, near-zero CO2/kWh, zero particulate/kWh
3) Long-lasting hydro plants, that have low-cost/kWh, near-zero-CO2/kWh, zero particulate/kWh
NOTE: Cost shifting and subsidies have not yet affected NE wholesale prices, because the percent of new RE (mostly wind and solar) on the NE grid is very small, after 20 years of subsidies.
The image shows the negligeable “contribution” of wind + solar to the NE grid load, during 2021, after 20 years of subsidies!!
Wind and solar became significant in Germany and Denmark after more than 20 years of subsidies, resulting in:
- Politicians excessively allocating RE costs to households, thereby greatly increasing household electric rates.
- Politicians keeping industrial rates artificially low for international competitiveness reasons (a hidden trade subsidy). See URL
https://www.windtaskforce.org/profiles/blogs/german-household-elect...
2) Wind/Solar Counteracting/Balancing Costs
Variable/intermittent wind and solar requires a fleet of quick-responding, counteracting/balancing power plants, usually combined-cycle, gas-turbine plants, CCGTs, and hydro plants, with adequate nearby fuel supply to cover all circumstances, fully staffed, kept in good working order, ready to perform service, on a less than minute-by-minute basis, 24/7/365, as demanded by the independent grid operator, such as ISO-NE, especially during:
1) Days with variable cloudiness
2) Days with panels covered with snow and ice
3) Days with foggy conditions
4) Late afternoon/early evening to mid-morning the next day.
5) Peak demand hours of late afternoon/early evening, when wind and solar usually are minimal
6) Simultaneous wind/solar lulls, when the output of both is minimal for up to 5 to 7 days, sometimes followed by another multi-day wind/solar lull. These URLs provide examples of multi-day, simultaneous wind/solar lull conditions in Germany and New England
https://www.windtaskforce.org/profiles/blogs/analysis-of-a-6-day-lu...
http://www.windtaskforce.org/profiles/blogs/wind-plus-solar-plus-st...
https://www.windtaskforce.org/profiles/blogs/wind-and-solar-energy-...
https://www.windtaskforce.org/profiles/blogs/playing-russian-roulet...
Without the fleet of counteracting/balancing plants, variable wind/solar power could not be fed into the grid.
That means, wind/solar power cannot ever function on its own.
The more wind/solar fed to the grid, the greater the fleet capacity, MW, in counteracting/balancing mode.The counteracting/balancing costs are almost entirely due to wind/solar output variations and intermittencies.
The fleet has to operate far from its preferred/more economical modes of operation. These plants experience:
1) More up/down production at lesser efficiencies; more Btu/kWh, more CO2/kWh, more c/kWh
2) More wear-and-tear, due to up/down production and more starts/stops; more Btu/kWh, more CO2/kWh, more c/kWh
4) Increased hot, synchronous (3,600 rpm), standby plant capacity, MW, to immediately provide power, if wind/solar generation suddenly decreases, or any other power system outage occurs.
5) Increased cold, standby plant capacity, MW, to provide power after a plant’s start-up period.
https://www.windtaskforce.org/profiles/blogs/fuel-and-co2-reduction...
When wind and solar were only a very small percent of the electricity loaded onto the NE grid, those counteracting/balancing costs were minimal, i.e., “buried in the data-noise of the grid”
Wind/solar became 28.4%, or 88.6 TWh, of the 312 TWh of electricity loaded onto the UK grid in 2020; excludes net imports
The curtailment/counteracting/balancing costs were £1.3 billion ($1.65 billion, or 1.9 c/kWh) in 2020, likely even more in 2021, 2022, 2023.
The 1.9 c/kWh would exponentially increase to 6 – 8 c/kWh at 50% wind/solar, because of increased costs of curtailment/counteracting/balancing
The US cost would be about 4000/312 x 1.65 = $21.2 billion, on a pro-rated basis, if 28.4% wind/solar loaded onto the US grid.
https://www.windtaskforce.org/profiles/blogs/grid-balancing-costs-s...
https://www.statista.com/statistics/514874/energy-mix-uk/
Those costs should have been charged to the Owners of wind and solar systems (the grid disturbers), but, in reality, they were politically shifted to taxpayers, ratepayers, and government debts.
Those costs are in addition to the various government subsidies, which are also politically shifted to taxpayers, ratepayers, and government debts.
3) Wind/Solar Grid Extension/Reinforcement Cost
Variable/intermittent wind and solar requires a significant extension/reinforcement of the grid.
The estimated capital cost of upgrading the UK grid for Net Zero by 2050 is about £200 Billion, which would be at least $2.0 TRILLION for the US, on a pro-rated basis, such as based on grid load or GDP.
https://www.windtaskforce.org/profiles/blogs/the-200-billion-bill-f...
A significant portion of those costs should be charged to the Owners of wind and solar systems (the grid disturbers), but, in reality, they will be politically shifted to taxpayers, ratepayers, and government debts.
Those costs are in addition to the various government wind/solar subsidies, which will also be politically shifted to taxpayers, ratepayers, and government debts.
4) CO2 Reduction, due to Wind, less than Claimed
Ireland: In Ireland, with 17% wind loaded onto the Irish grid in 2012, the officially claimed CO2 reduction of grid CO2/kWh was 17%
However, analysis of 15-minute grid operating data, and corresponding fuel consumption data of each power plant connected to the grid, showed, it was only 0.526 x 17% = 8.94%, due to inefficient operation of the other power plants, when counteracting/balancing the variable output of wind, as above described.
The only reason the Irish government finally had to admit to the lesser CO2 reduction, is because public pressure forced the government to hold hearings on why Irish gas imports had not decreased with increased wind; “the smoking gun that did them in”
After 2012, Brussels gave money to Ireland to put in major capacity connections to the much larger UK and French grids. The Irish wind output variations were only a very small percent of the electricity loaded onto those grids, i.e., “buried in the data noise of the grids”
The UK: The UK, with 28.4% wind/solar in 2020, has a CO2-reduction factor significantly less than 0.526, because even more curtailment/counteracting/balancing is required.
Ireland, the UK, US, Germany, Spain, etc., have been over claiming CO2 reduction from wind/solar for decades, with connivance from Brussels. See explanation in URL
https://www.windtaskforce.org/profiles/blogs/fuel-and-co2-reduction...
5) Germany, Denmark, etc., Using Nearby Grids to Counteract/Balance Their Variable Wind/Solar
Germany and Denmark have been doing that for decades, as they increased their wind/solar buildouts.
Germany has strong connections to the grids of nearby countries, including Norway, which is connected to Norgrid, which has lots of hydro in Sweden and Norway and nuclear in Sweden, all steady, traditional sources of electricity.
There was quite some panic in 2021, well before Ukraine events, which started in February 2022, when, because of low water and low wind in Europe, Norway and France could not export electricity to Germany, which had to restart coal plants and keep its 3 remaining nuclear plants in service longer than intended.
Germany cannot counteract/balance its own wind/solar, and when wind was lacking, it did not have a sufficient fleet of traditional counteracting/balancing plants, staffed, fueled, and with adequate fuel storage to provide 24/7/365 electricity. Germany had to impose rationing measures on its industry and households.
NOTE: Solar Panels Are Much More Carbon-Intensive Than Experts are Willing to Admit
https://www.windtaskforce.org/profiles/blogs/solar-panels-are-more-...
East Coast Hurricanes
East Coast wind systems, with 850-ft-tall wind turbines, will be subject to hurricane-strength winds. See image
.
.
Area Requirements for Biden's 30,000 MW Wind Fantasy by 2030
The 12-MW wind turbines would be arranged on a grid, spaced at least 1.5 mile apart (8 rotor diameters), about 2.25 sq mile per wind turbine. The minimum sea area requirement for 30,000/12 = 2,500 wind turbines would be 5,625 sq. miles, or 3,600,000 acres
US Offshore Wind Systems Benefitting Big Wind in Europe
Almost the entire physical supply and installation of the 30,000 MW of offshore wind systems would be provided by EU companies, because they have the required expertise and the domestic onshore facilities and seagoing facilities, due to building at least 25,014 MW (end 2020) of offshore systems, starting in 1991. See URL
https://windeurope.org/about-wind/history/
Those companies would hire qualified US labor, as needed.
Those companies would build US facilities, as needed.
Those companies would not be interested in training a potential competitor.The offshore wind turbine industry is trending towards wind turbines with capacities of 8 to 12 MW.
European experience indicates, the larger-capacity wind turbines require more maintenance/kWh, and have more downtime/kWh.
Currently, EU companies have capacity to install 8 to 10 MW offshore wind turbines, at a rate of about 1,500 MW/y
Adding 30,000 MW of very expensive offshore wind systems, would be of primary benefit to Europe which would:
1) Make financing, designing, building, assembling, operating and maintaining, replacing, almost all of the wind turbine systems
2) Purposely saddle the US, a trade competitor, with much higher energy costs, than at present
3) Continue to benefit from the significant US annual expenditures for defending Europe.
US Offshore Wind System Experience
US infrastructure for large wind turbines is practically non-existent; only GE is active in that space. It would take years to create US sites for producing offshore wind turbines, and build the sea-going ships and specialized cranes to transport, assemble, and service the wind turbines.
Duplicating the EU onshore and seagoing facilities in the US, PLUS implementing 30,000 MW of offshore wind systems in less than 7 years, 2023 to 2030, at a rate of 30,000/7 = 4,286 MW/y, would be physically impossible.
In the real world, any independent energy systems analyst would deem Biden’s offshore wind scheme a total fantasy.
https://www.windtaskforce.org/profiles/blogs/high-costs-of-wind-sol...
Additional URLs for information
https://www.windtaskforce.org/profiles/blogs/wind-and-solar-provide...
https://www.boem.gov/sites/default/files/renewable-energy-program/W...
The EU vs the US
The US, with a low-cost, self-sufficient, energy sector would attract European, Korean, Japanese, etc., energy-intensive, heavy-industry and industrial product production to the US.
Europe is interested to make sure the US has a high-cost electrical sector, with lots of high-priced wind and solar and batteries, to handicap the US, and to enhance its competitiveness vs the US. The UN is helping out by urging the US to expensively reduce its CO2 by 50% by 2030, which is not possible. See URL.
https://wattsupwiththat.com/2021/04/21/the-latest-co2-fantasy/
- Europe desperately needs more low-cost gas from Russia to remain competitive on world markets
- Europe has to build out wind and solar to limit energy imports from unstable countries; the US does not need to.
The US is falling into the EU very expensive, debilitating energy trap.
BTW, Europe must have wind and solar, because it imports huge quantities of energy (mostly from unfriendly countries), whereas the US is nearly energy independent
https://www.windtaskforce.org/profiles/blogs/the-plot-is-thickening...
Part 2
UK 26,000 MW OF ADDITIONAL OFFSHORE WIND BY 2030; AN EXPENSIVE FANTASY
UK government bureaucrats, etc., justify the build out of 26,000 MW of additional offshore wind turbines by 2030, in less than 7 years, because: 1) the UK is the "Saudi Arabia of Wind", and 2) several hundred thousand new jobs will be created (a number likely picked out of the air), and 3) household electric bills will be lower (which is the opposite of what actually happened). See below
It took more than 23 years for the UK to expensively build 14,000 MW of offshore wind turbines by end 2022, that produce high-cost electricity, destabilizes the UK grid, and caused greatly increased household electric bills.
How many steady, long-term jobs, with good benefits, were created due to offshore wind turbines in the UK?
No answer to that question is available.
For decades, Denmark and Germany, both wind mavens, had the highest household electric rates, c/kWh, in Europe.
But that “honor” was passed to the UK, which now has the highest household electric rates in Europe, by far.
See image in URL
https://www.nationalworld.com/news/politics/energy-prices-uk-britai...
UK Grid Counteracting/Balancing Costs
Wind/solar became 28.4%, or 88.6 TWh, of the 312 TWh of electricity loaded onto the UK grid in 2020; excludes net imports
The counteracting/balancing costs were £1.3 billion ($1.65 billion, or 1.9 c/kWh) in 2020, likely even more in 2021, 2022, 2023.
The US cost would be about 4000/312 x 1.65 = $21.2 billion, on a pro-rated basis, if 28.4% wind/solar loaded onto the US grid.
https://www.windtaskforce.org/profiles/blogs/grid-balancing-costs-s...
https://www.statista.com/statistics/514874/energy-mix-uk/
Those costs should be charged to the Owners of wind and solar systems (the grid disturbers), but, in reality, they will be politically shifted to taxpayers, ratepayers, and government debts.
Those costs are in addition to the various government wind/solar subsidies, which will also be politically shifted to taxpayers, ratepayers, and government debts.
UK Grid Upgrades for Net Zero by 2050
The estimated capital cost of upgrading the UK grid for Net Zero by 2050 is about £200 Billion, which would be at least $2.0 TRILLION for the US, on a pro-rated basis, such as on grid load or GDP
https://www.windtaskforce.org/profiles/blogs/the-200-billion-bill-f...
A significant portion of those costs should be charged to the Owners of wind and solar systems (the grid disturbers), but, in reality, they will be politically shifted to taxpayers, ratepayers, and government debts.
Those costs are in addition to the various government wind/solar subsidies, which will also be politically shifted to taxpayers, ratepayers, and government debts.
-
-
LEGISLATOR’s CHEVY BOLT CATCHES FIRE WHILE CHARGING ON DRIVEWAY IN VERMONT
https://www.windtaskforce.org/profiles/blogs/chevy-bolt-catches-fir...
THETFORD; July 2, 2021 — A fire destroyed a 2019 Chevy Bolt, 66 kWh battery, battery pack cost about $10,000, or 10000/66 = $152/kWh, EPA range 238 miles, owned by state Rep. Tim Briglin, D-Thetford, Chairman of the House Committee on Energy and Technology.
He had been driving back and forth from Thetford, VT, to Montpelier, VT, with his EV, about 100 miles via I-89
He had parked his 2019 Chevy Bolt on the driveway, throughout the winter, per GM recall of Chevy Bolts
He had plugged his EV into a 240-volt charger.
His battery was at about 10% charge at start of charging, at 8 PM, and he had charged it to 100% charge at 4 AM; 8 hours of charging.
Charging over such a wide range is detrimental for the battery. However, it is required for “range-driving”, i.e., making long trips. See Note
NOTE: Range-driving is an absolute no-no, except on rare occasions, as it would 1) pre-maturely age/damage the battery, 2) reduce range sooner, 3) increase charging loss, and 4) increase kWh/mile, and 5) increase the chance of battery fires.
Charging at 32F or less
Li-ions would plate out on the anode each time when charging, especially when such charging occurred at battery temperatures of 32F or less.
Here is an excellent explanation regarding charging at 32F or less.
https://electronics.stackexchange.com/questions/263036/why-charging...
Fire in Driveway
Firefighters were called to Briglin’s house on Tucker Hill Road, around 9 AM Thursday.
Investigators from the Vermont Department of Public Safety Fire and Explosion Investigation Unit determined:
1) The fire started in a compartment in the back of the passenger’s side of the vehicle
2) It was likely due to an “electrical failure”. See Note
NOTE: With a crushed gasoline car, you just put it in a melting pot to make new steel
That cannot be done with EVs
You have to partially disassemble, and put the parts in a hazardous waste facility, which has not been built yet, even in China, and the rest gets molten down. All a lot more expensive
I hear, the cost of insurance for an EV is about 2 to 3 times the cost of a gasoline car.
If an EV is in an accident, the battery may be jolted, which may damage cells, which may cause a future fire, in your garage.
Insurance companies are not stupid. Your house insurance may increase as well. The loser is YOU, not THEM
NOTE: Regarding the Chevy Bolt, it likely was one or more battery cells shorting out, which creates heat, which burns nearby items, which creates a fire that is very hard to extinguish. See Appendix
https://www.vnews.com/Firefighters-put-out-blaze-in-car-of-Vt-State...
https://www.engadget.com/gm-chevy-bolt-fire-warning-215322969.html
https://electrek.co/2020/11/13/gm-recall-chevy-bolt-evs-potential-f...
GM Recall of Chevy Bolts
In 2020, GM issued a worldwide recall of 68,667 Chevy Bolts, all 2017, 2018 and 2019 models, plus, in 2021, a recall for another 73,000 Bolts, all 2020, 2021, and 2022 models.
GM set aside $1.8 BILLION to replace battery modules, or 1.8 BILLION/(68,667 + 73,000) = $12,706/EV.
https://insideevs.com/news/524712/chevrolet-bolt-battery-recall-cost/
https://thehill.com/policy/transportation/568817-gm-expands-bolt-ev...
Owners were advised not to charge them in a garage, and not to leave them unattended while charging, which may take up to 8 hours; what a nuisance!
I wonder what could happen during rush hour traffic, or in a parking garage, or at a shopping mall, etc.
Rep. Briglin heeded the GM recall by not charging in his garage. See URLs
https://www.ericpetersautos.com/2021/09/16/electric-social-distancing/
https://www.windtaskforce.org/profiles/blogs/some-ne-state-governme...
NOTE:
- Cost of replacing the battery packs of 80,000 Hyundai Konas was estimated at $900 million, about $11,000 per vehicle
https://insideevs.com/news/492167/reports-lg-chem-cost-hyundai-batt...
- EV batteries should be charged from 20 to 80%, to achieve minimal degradation and long life, plus the charging loss is minimal in that range
- Charging EVs from 0 to 20% charge, and from 80 to 100% charge:
1) Uses more kWh AC from the wall outlet per kWh DC charged into the battery, and
2) Is detrimental to the battery.
3) Requires additional kWh for cooling the battery while charging.
- EV batteries must never be charged, when the battery temperature is less than 32F; if charged anyway, the plating out of Li-ions on the anode would permanently damage the battery.
https://www.energy.gov/eere/articles/how-does-lithium-ion-battery-work
.
Maine as Third World Country:
CMP Transmission Rate Skyrockets 19.6% Due to Wind Power
Click here to read how the Maine ratepayer has been sold down the river by the Angus King cabal.
Maine Center For Public Interest Reporting – Three Part Series: A CRITICAL LOOK AT MAINE’S WIND ACT
******** IF LINKS BELOW DON'T WORK, GOOGLE THEM*********
(excerpts) From Part 1 – On Maine’s Wind Law “Once the committee passed the wind energy bill on to the full House and Senate, lawmakers there didn’t even debate it. They passed it unanimously and with no discussion. House Majority Leader Hannah Pingree, a Democrat from North Haven, says legislators probably didn’t know how many turbines would be constructed in Maine if the law’s goals were met." . – Maine Center for Public Interest Reporting, August 2010 https://www.pinetreewatchdog.org/wind-power-bandwagon-hits-bumps-in-the-road-3/From Part 2 – On Wind and Oil Yet using wind energy doesn’t lower dependence on imported foreign oil. That’s because the majority of imported oil in Maine is used for heating and transportation. And switching our dependence from foreign oil to Maine-produced electricity isn’t likely to happen very soon, says Bartlett. “Right now, people can’t switch to electric cars and heating – if they did, we’d be in trouble.” So was one of the fundamental premises of the task force false, or at least misleading?" https://www.pinetreewatchdog.org/wind-swept-task-force-set-the-rules/From Part 3 – On Wind-Required New Transmission Lines Finally, the building of enormous, high-voltage transmission lines that the regional electricity system operator says are required to move substantial amounts of wind power to markets south of Maine was never even discussed by the task force – an omission that Mills said will come to haunt the state.“If you try to put 2,500 or 3,000 megawatts in northern or eastern Maine – oh, my god, try to build the transmission!” said Mills. “It’s not just the towers, it’s the lines – that’s when I begin to think that the goal is a little farfetched.” https://www.pinetreewatchdog.org/flaws-in-bill-like-skating-with-dull-skates/
Not yet a member?
Sign up today and lend your voice and presence to the steadily rising tide that will soon sweep the scourge of useless and wretched turbines from our beloved Maine countryside. For many of us, our little pieces of paradise have been hard won. Did the carpetbaggers think they could simply steal them from us?
We have the facts on our side. We have the truth on our side. All we need now is YOU.
“First they ignore you, then they laugh at you, then they fight you, then you win.”
-- Mahatma Gandhi
"It's not whether you get knocked down: it's whether you get up."
Vince Lombardi
Task Force membership is free. Please sign up today!
Hannah Pingree on the Maine expedited wind law
Hannah Pingree - Director of Maine's Office of Innovation and the Future
"Once the committee passed the wind energy bill on to the full House and Senate, lawmakers there didn’t even debate it. They passed it unanimously and with no discussion. House Majority Leader Hannah Pingree, a Democrat from North Haven, says legislators probably didn’t know how many turbines would be constructed in Maine."
https://pinetreewatch.org/wind-power-bandwagon-hits-bumps-in-the-road-3/
© 2026 Created by Webmaster.
Powered by
![]()
You need to be a member of Citizens' Task Force on Wind Power - Maine to add comments!
Join Citizens' Task Force on Wind Power - Maine