NEW ENGLAND GOVERNORS MISSTATEMENTS ON WIND, SOLAR, AND LNG
Connecticut Governor Dannell Malloy, Massachusetts Governor Charlie Baker, New Hampshire Governor Chris Sununu, Rhode Island Governor Gina Raimondo, and Vermont Governor Phil Scott held a meeting about energy and issued a statement, which included the following topics.
The wording of the Governors Statement reflects the thinking of various RE proponents that appear to have hijacked the proceedings, such as the:
- Conservation Law Foundation
- Acadia Center
- New Hampshire Office of the Consumer Advocate
- PowerOptions
- RENEW Northeast
- Vermont Energy Investment Corporation
- Cere
- Sierra Club
Preparing the Governors Statement: The Governors Statement is a complex, carefully crafted document, which was released and published immediately after the conclusion of the meeting, which is remarkable.
It is likely various RE entities had been planning the agenda of the meeting, what to leave in, and especially what to leave out, such as 1) costs, 2) increased capacity gas lines, 3) more supply from Hydro-Quebec, 4) and that wind and solar, onshore and offshore, likely would be near zero during cold spells, year after year.
It is likely they pre-wrote some paragraphs regarding each agenda item. They likely wanted to make sure the standard RE mantras were included.
http://www.windtaskforce.org/profiles/blogs/new-england-governors-s...
1) Investment and siting of infrastructure for new, clean generation resources such as large-scale hydropower and off-shore wind, the production of which correlates "very well" with cold weather periods.
That statement does not agree with the facts.
Hydropower
New England is already using all the sites suitable for large-scale hydropower, say 150 MW and up, with storage reservoirs. Such sites would need upper and lower reservoirs to be pumped storage hydro plants, which would be essential to store electricity when future wind and solar generation would be in excess of demand.
A better approach would be to have robust connections with the Canadian grid and purchase more hydropower from Canada at about 6 c/kWh. Canada could perform CO2-free peaking, filling-in and balancing of NE wind and solar, instead of NE using CO2 emitting gas turbines to perform those services.
http://www.windtaskforce.org/profiles/blogs/increased-canadian-hydr...
http://www.windtaskforce.org/profiles/blogs/green-mountain-power-co...
Wind Power
There is no weather data showing any meaningful on shore and offshore wind generation would occur during all cold spells in New England, year after year. That would be a true miracle.
Martha’s Vineyard average hourly wind speed is 17.3 mph, ranging from 8 mph to 27 mph, during January. The wind speed is greater than 27 mph during 10% of the hours of January (72 hours), and less than 8 mph during 10% of the hours of January (72 hours). It takes 3.5 mph to move the rotor, i.e., minimal wind electricity is generated at low wind speeds, including during multi-day wind lulls during January and December.
To claim “it correlates very well with cold periods” is pure nonsense, a deceptive/naive attempt to justify expensive, offshore wind follies that generate electricity at 18 c/kWh or higher. Affordable? Sure.
Any energy systems analyst at ISO-NE has known this for decades, but the lay public, more prone to succumb to fairy tales, is not given any clear explanation, as it would rain on the rosy, feel-good RE parade.
https://weatherspark.com/y/26840/Average-Weather-in-Vineyard-Haven-...
During the 2017/2018 cold spell, generation from about 1279 MW of wind turbines connected to the high voltage grid, varied from a high of 1150 MW to lows of less than 100 MW on 5 days.
To rely on wind for a major part of electrical service at 99.97% reliability, 24/7/365, during any cold spell, year after year, would be like playing Russian roulette. See page 50.
https://www.iso-ne.com/static-assets/documents/2018/01/20180112_col...
However, there would be 100% certainty that nuclear, gas, coal and oil generation would be at high levels during every cold spell, year after year.
The US has a plentiful domestic, low-cost fuel supply, unlike Europe which has to import most of its more expensive fuel supply and has to rely on more expensive wind and solar.
The political restriction and obstructionism, primarily by Massachusetts and New York, of the secure, domestic, low-cost gas fuel supply from Pennsylvania, to fulfill utopian agendas of RE proponents, has resulted in near-blackout conditions during several cold spells of the past few years.
In New England, there are many hours in winter when wind is minimal, onshore and offshore, as proven by minute-by-minute wind generation data shown on ISO-NE websites, and the minute-by-minute generation of the offshore 30 MW Block Island Wind Farm. See Appendix.
NOTE: During winter, solar is minimal, or zero, at least 80% of hours of the winter period of November through March. Solar is strictly a midday affair, i.e., operationally irrelevant for any 24-h electric service unless very low-cost storage becomes available.
NOTE: The wholesale prize of offshore wind electricity is at least 18 c/kWh, not affordable even for Massachusetts. The annual average NE wholesale price has been about 5 c/kWh since 2009, due to low cost nuclear and low-cost, domestic natural gas.
NOTE: Massachusetts still has not revealed the turnkey capital cost of the offshore wind projects, $/MW, and their energy costs, c/kWh. Why is MA hiding the data?
ISO-NE Real-Time Grid Operating Data
Fortunately, ISO-NE, the New England grid operator, posts real-time data regarding grid operations, every few minutes, on a daily basis. See URL, go to fuel mix graph, click on rectangle with arrow and download the outputs, MW, of the various NE electricity producers connected to the high voltage grid. The real-time load, MW, on the NE grid system is also shown. The second URL shows daily generation percent by source.
https://www.iso-ne.com/isoexpress/web/charts
2018_daygenbyfuel_SUMMARIZED.xlsx
NOTE: It is best to download the daily data just before midnight to capture almost all of the data for that day. If one waits until after midnight, a new list of data appears, and the prior list is not visible on the URL. The data likely is somewhere else, but I have not been able to find it.
ISO-NE Report: Cold Weather Operations December 24, 2017 – January 8, 2018
https://www.iso-ne.com/static-assets/documents/2018/01/20180112_col...
http://www.windtaskforce.org/profiles/blogs/low-cost-domestic-pipel...
http://www.windtaskforce.org/profiles/blogs/conservative-law-founda...
- Low Renewables Generation After 20 Years of Subsidies
Generation from all renewables (wind, refuse, wood, landfill gas, methane) was 9%, 7% and 6% of the total NE grid load on 24 Dec 2017, 1 Jan 2018, and 6 Jan 2018, respectively. See page 14.
- Unreliable Variable Solar Generation
Generation from about 2350 MW of PV solar at end 2017, on distribution grids, such as residential rooftop solar, varied from zero to 750 MW; was minimal during almost all hours of the period. Could not be relied on for electrical service at 99.97% reliability, 24/7/365. See page 48.
Generation from about 82 MW of PV solar at end 2017, on high voltage grids, such as large-scale, field-mounted solar, varied from zero to 26 MW, was minimal during almost all hours of the period. Could not be relied on for electrical service at 99.97% reliability, 24/7/365. See page 49.
- Unreliable Variable Wind Generation
Generation from about 1279 MW of wind turbines at end 2017 varied from a high of 1150 MW to lows of less than 100 MW on 5 days. Could not be relied on for electrical service at 99.97% reliability, 24/7/365. See page 50.
NOTE: Wind, installed capacity was 1379 MW at end 2017, of which about 100 MW in Maine is connected to the Canadian grid, due to a lack of transmission to southern New England.
https://www.awea.org/wind-energy-facts-at-a-glance
2) Working with Congressional delegations to address whether the Jones Act should be modified to ensure that LNG can be delivered in a timely manner during winter months.
The Jones Act requires goods shipped between U.S. ports be transported on ships built, owned and operated by United States citizens or permanent residents, i.e., foreign LNG ships cannot ship LNG from Cheniere, LA to Everett, MA.
If LNG came from LA, the price would be about 2 times pipeline gas from Pennsylvania.
If LNG came from Russia and the Middle East, the price would be about 3 times pipeline gas from Pennsylvania.
http://www.windtaskforce.org/profiles/blogs/low-cost-domestic-pipel...
RE Proponents Opposed to Increased Gas Line and Gas Storage Capacity
- When natural gas is turned into LNG, it becomes much more expensive.
- The cost and delivery of imported Russian and Middle East LNG is volatile, due to geopolitics.
- If utilities import more LNG, additional, very expensive, LNG storage tanks would be required.
Increased gas line and gas storage capacity for reliable, low-cost domestic gas would save at least $1.0 billion/y, instead of using imported, politically insecure, LNG from Russia and the Middle East, for decades while unreliable, expensive wind and solar are being implemented. See below table.
RE proponents are opposed to increased-capacity gas lines, because it interferes with their utopian dreams of what the NE grid “should look like”. Remember, almost all of those people never even analyzed, designed and operated any energy system!
Their utopian dreams do not agree with what an electric system has to look like to reliably function, under all circumstances, without any significant inputs from unreliable wind and solar, during cold spells, year after year, according to ISO-NE energy system experts.
Here is a thought of an RE proponent:
"If we put that money into natural gas lines now, we can expect that our system's not going to look much different in 2050 than it does today," said regional energy analyst Shanna Cleveland, who's been following the situation for a long time, first at the Conservation Law Foundation, and now at Ceres, which tries to bridge business investors and environmental groups.
"This is really a once-in-a-lifetime opportunity, and we're standing right here at the point where we can decide what our system will look like in the future," she added.
http://www.wbur.org/news/2015/03/11/natural-gas-lng-everett-terminal
Increased Future Load on New England Grid and Increased Imported LNG
Future LNG deliveries would have to significantly increase due to:
- Nuclear plants closing down. Their replacements would have to be combined-cycle gas turbine plants, because adequate capacity of wind and solar and other measures could not be implemented in a timely fashion. Those plants likely would be fired with expensive Russian and Middle East LNG, if pipelines are not built. About 68 tanker loads, each carrying 67,500 metric ton of LNG, would be required per year. See below table.
- Increased use of heat pumps and plug-in electric vehicles. They would increase NE electrical consumption by at least 25% to 30%. Such an increase likely could not be offset by increased efficiency. That means even more of expensive Russian and Middle East LNG and tanker loads would be required each year, if pipelines are not built.
That also means:
- Imports of expensive Russian and Middle East LNG would not be "temporary" or occur "only during cold spells", as RE proponents are deceptively/naively claiming, but at a high level throughout the year, for decades.
- The Everett, MA., LNG storage and gasification terminal would need to have at least triple the capacity.
- The cost of electricity generated with the expensive LNG would be about 9 c/kWh compared with about 5 c/kWh with domestic pipeline gas. See below table.
- The US trade balance would become even worse, and foreigners would be the primary beneficiaries.
- US offshore wind will be bonanza for Europeans, because they have all the infrastructure and experience accumulated over at least 30 years.
- MA and NY obstructing additional low-cost gas supply from Pennsylvania would result in Russia and the Middle East providing huge quantities of LNG at 3 times the cost of domestic Pennsylvania gas for decades. The insanity of it is beyond rational. See below.
- The viability and growth of the future NE economy would be adversely affected.
Replacing Nuclear Plants With Gas Turbine Plants
When the nuclear plants are closed in the near future, a much less costly option would be to replace them with gas turbine plants. However, those gas turbines would use expensive ($9/million Btu), imported Russian and Middle East LNG, if utopian dreams of RE proponents prevail. Those same RE proponents have opposed/obstructed the supply of more low-cost ($3/million Btu), domestic gas from Pennsylvania.
- Required capacity of new gas turbine plants = 1.2, reserve margin x 31538 GWh/y x 1000 MWh/GWh/(8766 h/y x 0.75, capacity factor) = 5756 MW, say 6000 MW of gas plants that would burn gas from LNG.
- Required Capital cost = 6000 MW x $1.5 million/MW = $9 billion.
- Required Vaporized LNG = (31538 GWh/y x 1000000 kWh/GWh x 3412 Btu/kWh/0.5, efficiency)/(1000 Btu/standard cf/1000000000) = 215.2 standard bcf/y.
Cost of Additional Gas Line From Pennsylvania: If a new gas line were built from Pennsylvania to Massachusetts for about $1.0 billion, it would pay for itself in a few years, because the use of Russian and Middle East LNG is much more costly than domestic gas.
Cost of LNG Terminal Capacity Expansion: A very costly capacity expansion of the present LNG terminal in Everett, MA., would be required. See table.
https://www.eia.gov/dnav/ng/hist/na1278_yevtt-ntd_3M.htm
Cost/y |
Nuclear |
Domestic gas |
Louisiana LNG |
Russia+ Middle East LNG |
GWh/y |
GWh/y |
GWh/y |
GWh/y |
|
Generation |
31538 |
31538 |
31538 |
31538 |
kWh |
1 |
1 |
1 |
|
Btu/kWh |
3412 |
3412 |
3412 |
|
Efficiency |
0.5 |
0.5 |
0.5 |
|
Btu/kWh |
6824 |
6824 |
6824 |
|
$/million Btu |
3 |
6 |
9 |
|
Cost, fuel only, $/kWh |
0.0205 |
0.0409 |
0.0614 |
|
Cost, other, $/kWh |
0.0300 |
0.0300 |
0.0300 |
|
Cost, c/kWh |
0.045 |
0.0505 |
0.0709 |
0.0914 |
Cost, million/y |
1419 |
1592 |
2237 |
2883 |
Required Tanker Loads: About 68 tanker loads of Russian and Middle East LNG would be required per year. See table.
Generation, GWh/y |
31538 |
Btu/ft3 |
1000 |
Btu/kWh |
3412 |
Efficiency |
0.5 |
LNG as gas, cf/y |
215215312000 |
LNG as gas, bcf/y |
215.2 |
Gas to LNG factor |
600 |
LNG, bcf/y |
0.358692187 |
cf/m3 |
35.315 |
LNG, bm3/y |
0.010156936 |
LNG, kg/m3 |
450 |
LNG, billion kg/y |
4.5706 |
kg/ton |
1000 |
LNG, billion ton/y |
0.004571 |
LNG, million ton/y |
4.571 |
Tanker LNG capacity, m3 |
150000 |
LNG, kg/m3 |
450 |
kg/ton |
1000 |
LNG/tanker, ton |
67500 |
Tanker loads/y |
68 |
Replacing Gasoline Consumption With Electricity in New England
http://www.windtaskforce.org/profiles/blogs/replacing-gasoline-cons...
Electrifying the NE transportation sector would result in significantly increased load and generation on the NE grid
EVs Charging, Impact on NE Grid and Capital Cost: RE proponents claim EVs would be charged at night, and that it would “flatten the demand” curve. In reality, peak demands would occur at night, instead of during the day.
- NE monthly average travel is about 130.593/12 = 10.88 billion miles; summer monthly maximum about 10.88 x 1.14 = 12.41 b miles, winter monthly minimum about 10.88/1.14 = 9.55 b miles. Daily averages, such as for a holiday weekend, likely would vary more than 14% from the annual average.
- If the EVs were charged 24 hours/d, the NE grid load increase during that peak month would be an average of 7404 MW. The new gas turbine capacity would be about 9873 MW, at a turnkey capital cost of $14.8 billion, plus $billions more for grid expansion and new LNG terminals or pipelines from Pennsylvania. See table 3.
- If the EVs were charged 8 hours/d, the NE grid load increase during that peak month would be an average of 22213 MW. The new gas turbine capacity would be about 29618 MW, at a turnkey capital cost of $44.4 billion, plus $billions more for grid expansion and new LNG terminals or pipelines from Pennsylvania. See table 3.
- That would be a significant increase of the normal nighttime demand of about 12000 MW. The normal daytime peak demand is about 22000 MW, and about 25000 MW during the late afternoons of hot summer days.
- The existing gas turbine capacity (which by now would include the gas turbines needed to replace nuclear) definitely would not be sufficient to provide that new nighttime demand and electricity.
Future Heat Pumps: Future heat pumps would impose very significant additional demand increases of daytime demand during hot days in summer (likely already with peak demands), and additional increases of winter demand during cold days in winter.
NE Grid Completely Inadequate: The winter demand increases due to EVs + heat pumps, would severely stress the NE generation capacity, fuel supply, and NE grid. In fact, NE generation capacity, fuel supply and almost all NE high voltage and distribution grids would be completely inadequate.
Electricity Storage Systems: It would be financially unfeasible to use storage, as the turnkey capital cost of one TWh of storage systems (as delivered to the HV grid) would cost about 1 billion kWh x $400/kWh = $400 billion. Even as future battery costs would decrease, the rest of the turnkey system costs likely would not. See Appendix and URLs.
Wind And Solar are Much Less than Meets the Eye: In 2017, the entire load on the NE grid was about 121.50 TWh, of which 78.8 TWh was provided by low-cost domestic gas and nuclear. To generate an additional 56.936 TWh for charging EVs with highly subsidized, expensive, unreliable, variable, intermittent wind and solar would be a huge physical challenge, especially during summer when wind is minimal for months (just look out the window), and during winter when solar is minimal for months. See Appendix.
RE proponents in Massachusetts and New York are adamantly opposing additional gas lines to provide additional low-cost gas from Pennsylvania. They want to wean us off gas and nuclear to save the world. They say we have plans to temporarily import Russian and Middle East LNG at 3 times the price of domestic gas, until we build out wind and solar.
RE proponents insist on saving the world by what would involve, during future decades:
- Permanently ruining tens of thousands of acres of meadows for solar, plus
- Permanently ruining hundreds of miles of pristine ridgeline for onshore wind, plus
- At least a thousand square miles of expensive offshore wind, plus
- Expanding the NE grid to double its capacity. See Appendix and URLs.
http://www.windtaskforce.org/profiles/blogs/new-england-governors-s...
http://www.windtaskforce.org/profiles/blogs/a-very-expensive-offsho...
http://www.windtaskforce.org/profiles/blogs/the-reality-of-wind-ene...
http://www.windtaskforce.org/profiles/blogs/wind-and-solar-conditio...
http://www.windtaskforce.org/profiles/blogs/the-true-cost-of-solar-...
http://www.windtaskforce.org/profiles/blogs/the-true-cost-of-wind-e...
http://www.windtaskforce.org/profiles/blogs/fuel-and-co2-reductions...
http://www.windtaskforce.org/profiles/blogs/wind-turbine-noise-adve...
http://www.windtaskforce.org/profiles/blogs/wind-and-solar-energy-l...
http://www.windtaskforce.org/profiles/blogs/wind-energy-is-highly-v...
APPENDIX 1
LNG Deliveries to Everett, MA, During 2017/2018 Gas Shortage
Delivering the LNG: The Christophe de Margerie, a Russian-owned icebreaking tanker, named after the deceased former CEO of Total, motored into Isle de Grain, UK, on Dec. 28, according to market information provider ICIS. It unloaded LNG from the new Yamal gas/oil plant in Russia. See URLs and Note.
https://www.reuters.com/article/lng-yamal-shipping/table-arc7-class...
https://photos.fleetmon.com/vessels/eduard-toll_9750696_2272589_XLa...
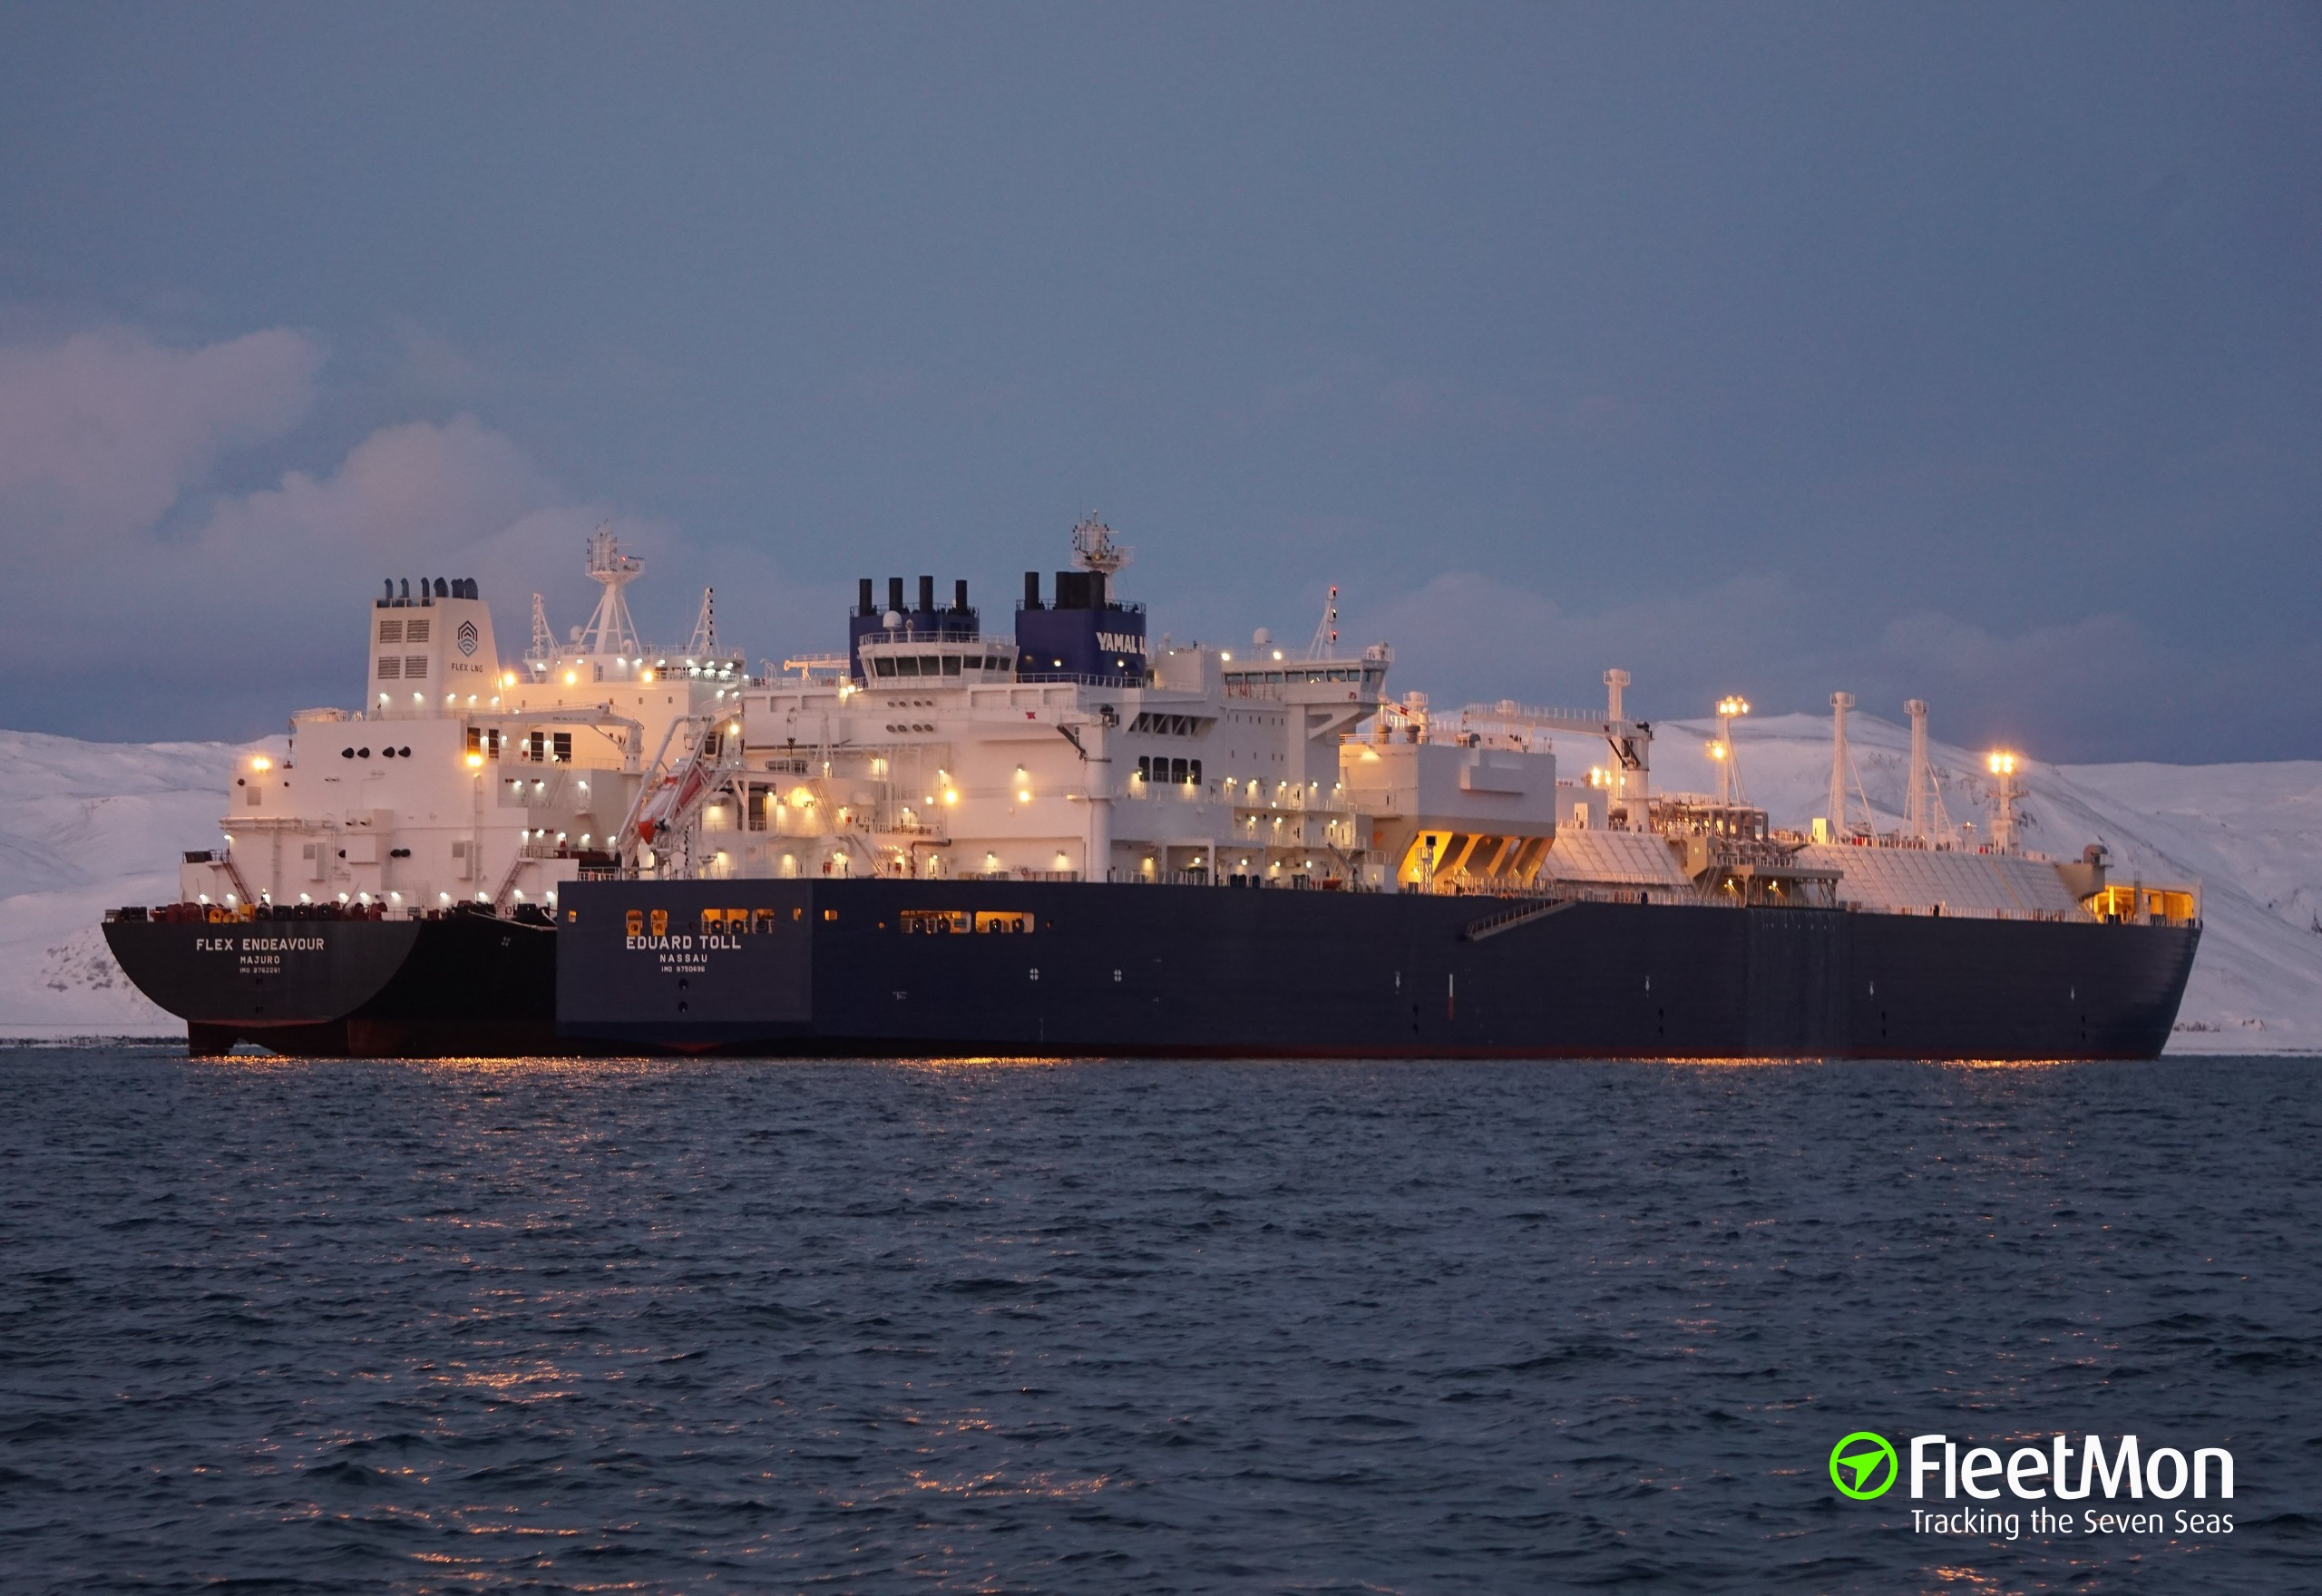
https://www.vesselfinder.com/?p=2511
The Gaselys, a French-owned tanker, arrived at Isle de Grain, UK, which is a large LNG storage facility in the UK that receives gas from many sources, including the Netherlands, Norway, Middle East, Russia, etc.
It took on a cargo of commingled LNG, including LNG from the Christophe de Margerie, an ice-breaking LNG carrier; LNG capacity 172,600 m3, or 77,670 metric ton. See Note.
Isle de Grain left the port on Jan. 7
It arrived at the ENGIE terminal (owned by a Frenchcompany) in Everett, Mass., three weeks later and delivered its payload.
Both tankers were built in Korea.
Everett LNG Terminal: LNG is imported from Trinidad and Tobago, where the gas is cooled to -260 F, turned into LNG, reducing the volume by 1/600th, then shipped to Everett.
The gas fields of Trinidad and Tobago have had decreasing outputs due to depletion, which means increased likelihood of more expensive LNG from Louisiana and highly expensive LNG from Russia and the Middle East, while various NE energy measures are being implemented during the next few decades.
Average LNG density = 450 kg/m3 x 0.62428 = 28.1 lb/ft3, depends on gas composition and temperature.
Everett has 2 LNG tanks, each 180 feet tall.
Everett LNG storage is about 160,461 m3, or 3.4 bcf (gas equivalent after vaporizing the LNG); peak vaporizing capacity 1.0 bcf/d; maximum continuous 0.715 bcf/d,
GDF Suez Gaz NA, a French company, owns the LNG plants in Trinidad and Tobago that supply most of the LNG to Everett.
It is amazing how much of the LNG infrastructure, and LNG storage plants, and LNG fleets are built and owned by foreigners! See URL.
http://www.windtaskforce.org/profiles/blogs/the-eu-and-internationa...
https://www.eenews.net/stories/1060076897
http://www.powermag.com/everett-lng-terminal-at-the-crossroads/?pag...
https://www.linkedin.com/pulse/lng-terms-tonsyear-cubic-meters-btus...
NOTE: Shipments of Russian oil and gas are not subject to sanctions, but “US persons and those in the US” are prohibited from financing Novatek, the lead company in the construction of Yamal LNG. The French, our friendly trading partner, took advantage of that.
- Yamal LNG; operated by Yamal LNG company; owned by Russian independent gas producer Novatek (50.1%), Total, a French company (20%), CNPC (20%) and Silk Road Fund (9.9%); capital cost $27 billion; capacity 16.5 million mt LNG, 3 trains.
- Yamal LNG 2: operated by Yamal LNG company; owned by Novatek (60%), Total (20%); Others (20%); capital cost $25.5 billion; capacity 19.8 million mt LNG, 3 trains.
https://www.ft.com/content/56f19604-fd6d-11e7-a492-2c9be7f3120a
https://www.bloomberg.com/news/articles/2017-12-14/russia-dreams-bi...
https://www.total.com/en/media/news/press-releases/yamal-lng-projec...
APPENDIX 2
High Electricity Prices for RE in New England: The highly subsidized wholesale prices of wind and solar paid by utilities to producers are much higher than in the rest of the US, because of New England’s mediocre wind and solar conditions.
http://www.windtaskforce.org/profiles/blogs/subsidized-solar-system...
Wind and Solar Far From Competitive with Fossil in New England: The Conservation Law Foundation claims renewables are competitive with fossil. Nothing could be further from the truth. Here is a list of NE wholesale prices and Power Purchase Agreement, PPA, prices.
NE field-mounted solar is 12 c/kWh; competitively bid
NE rooftop solar is 18 c/kWh, net-metered; GMP adds costs of 3.813 c/kWh, for a total of 21.813 c/kWh
http://www.windtaskforce.org/profiles/blogs/green-mountain-power-co...
NE wind offshore until recently about 18 c/kWh
NE wind ridgeline is at least 9 c/kWh
DOMESTIC pipeline gas is 5 c/kWh
Russian and Middle East imported LNG is at least 9 c/kWh
NE nuclear is 4.5 c/kWh
NE hydro is 4 c/kWh; about 10 c/kWh, if Standard Offer in Vermont.
Hydro-Quebec imported hydro is 6 - 7 c/kWh; GMP paid 5.549 c/kWh in 2016, under a recent 20-y contract.
NE annual average wholesale price about 5 c/kWh, unchanged since 2009, courtesy of low-cost gas and nuclear.
NOTE: Vineyard Wind, 800 MW, fifteen miles south of Martha’s Vineyard, using 8 or 10 MW turbines, 750 ft tall.
Phase 1 on line in 2021, electricity offered at an average of 8.9 c/kWh over 20 years
Phase 2 offered at an average of 7.9 c/kWh over 20 years
https://www.bostonglobe.com/business/2018/08/13/vineyard-wind-offer...
https://www.boem.gov/What-Does-an-Offshore-Wind-Energy-Facility-Loo...
NOTE: The NE grid is divided in regions, each with Local Market Prices, LMPs, which vary from 2.5 - 3.5 c/kWh from 10 pm to about 6 pm; slowly increase to about 6 - 7 c/kWh around noon time, when solar is maximal; are about 7 - 8 c/kWh in late afternoon/early evening (peak demand hours), when solar is minimal. Unusual circumstances, such as power plant or transmission line outages, can cause LMPs to increase to 20 - 40 c/kWh, and even higher when such events occur during peak demand hours.
NOTE: The above prices would be about 50% higher without the subsidies and even higher without cost shifting. See Appendix.
NOTE: Here is an ISO-NE graph, which shows for very few hours during a 13-y period were wholesale prices higher than 6 c/kWh. Those prices are low because of low-cost gas, low-cost nuclear and low-cost hydro. The last four peaks were due to:
- Pipeline constraints, aggravated by the misguided recalcitrance of pro-RE Governors of NY and MA
- Pre-mature closings of coal and nuclear plants
- Lack of more robust connections to nearby grids, such as New York and Canada. See URLs.
https://www.iso-ne.com/about/key-stats/markets/
http://truenorthreports.com/rolling-blackouts-are-probably-coming-t...
APPENDIX 3
Wind and Solar Conditions in New England: New England has highly variable weather and low-medium quality wind and solar conditions. See NREL wind map and NREL solar map.
https://www.nrel.gov/gis/images/100m_wind/awstwspd100onoff3-1.jpg
https://www.nrel.gov/gis/images/solar/national_photovoltaic_2009-01...
Wind:
- Wind electricity is zero about 30% of the hours of the year (it takes a wind speed of about 7 mph to start the rotors)
- Wind is minimal most early mornings and most late afternoons/early evenings (peak demand hours), especially during summer
- Wind often is minimal 5 - 7 days in a row in summer and winter, as proven by ISO-NE real-time generation data.
http://www.windtaskforce.org/profiles/blogs/daily-shifting-of-wind-...
- About 60% is generated at night, when demand is much less than during the late afternoons/early evenings
- About 60% is generated in winter.
- During winter, the best wind month is up to 2.5 times the worst summer month
- New England has the lowest capacity factor (about 0.262) of any US region, except the US South. See URL.
https://www.eia.gov/todayinenergy/detail.php?id=20112
Solar:
- Solar electricity is strictly a midday affair.
- It is zero about 65% of the hours of the year, mostly at night.
- It often is minimal 5 - 7 days in a row in summer and in winter, as proven by ISO-NE real-time generation data.
http://www.windtaskforce.org/profiles/blogs/daily-shifting-of-wind-...
- It is minimal early mornings and late afternoons/early evenings
- It is minimal much of the winter months
- It is minimal for several days with snow and ice on most of the panels.
- It varies with variable cloudiness, which would excessively disturb distribution grids with many solar systems, as happens in southern California and southern Germany on a daily basis.
- During summer, the best solar month is up to 4 times the worst winter month; that ratio is 6 in Germany.
- New England has the lowest capacity factor (about 0.145, under ideal conditions) of any region in the US, except some parts of the US Northwest.
NOTE: Even if the NE grid had large capacity connections with Canada and New York, any major NE wind lull and any major NE snowfall likely would affect the entire US northeast, i.e., relying on neighboring grids to "help-out" likely would not be feasible.
Wind Plus Solar:
- Wind plus solar production could be minimal for 5 - 7 days in summer and in winter, with snow and ice on most of the panels, as frequently happens during December, January and February, as proven by ISO-NE real-time generation data.
http://www.windtaskforce.org/profiles/blogs/daily-shifting-of-wind-...
If we were to rely on wind and solar for most of our electricity, massive energy storage systems (GWh-scale for Vermont, TWh-scale for NE) would be required to cover multi-day wind lulls, multi-day overcast/snowy periods, and seasonal variations. See URLs.
http://www.windtaskforce.org/profiles/blogs/wind-and-solar-energy-l...
http://www.windtaskforce.org/profiles/blogs/vermont-example-of-elec...
http://www.windtaskforce.org/profiles/blogs/seasonal-pumped-hydro-s...
http://www.windtaskforce.org/profiles/blogs/electricity-storage-to-...
http://www.windtaskforce.org/profiles/blogs/pumped-storage-hydro-in...
http://www.windtaskforce.org/profiles/blogs/wind-and-solar-hype-ver...
APPENDIX 4
Cost Shifting is the Name of the Game: Here is a list of the costs that were shifted, i.e., not charged to wind and solar owners, which make wind and solar appear to be much less costly, than in reality.
Those costs, as c/kWh, could be quantified, but it is politically convenient to charge them to: 1) ratepayers via rate schedules (taxes, fees and surcharges), 2) taxpayers, and 3) federal and state debts.
1) The various forms of inertia (presently provided by gas, coal, oil, nuclear, bio and hydro plants).
2) The filling-in, peaking and balancing by traditional generators due to wind and solar variability/intermittency.
3) Any battery systems to stabilize distribution grids with many solar systems.
4) Any measures to deal with DUCK curves, such as utility-scale storage and demand management
5) Grid-related, such as grid extensions and augmentations to connect and deal with wind and solar. See notes.
6) Utility-scale electricity storage (presently provided by the world’s fuel supply system).
https://www.neon-energie.de/Hirth-2013-Market-Value-Renewables-Sola...
Those items are separate from the high levels of subsidies, which also make wind and solar appear to be much less costly, than in reality. See Appendix.
All that enables RE proponents to endlessly proclaim: “Wind and solar are competitive with fossil and nuclear”.
NOTE: For example, to bring wind electricity from the Panhandle in west Texas to population centers in east Texas, $7 billion of transmission was built. The entire cost was “socialized”, i.e., a surcharge on residential electric bills.
NOTE: Often the grid connection of offshore wind systems is not included in the capital cost estimates, i.e., it is provided by the utilities that buy the electricity under PPAs. The cost is “socialized”, i.e., a surcharge on residential electric bills.
APPENDIX 5
Hydro-Quebec Electricity Generation and Purchases: Google this URL for the 2017 facts. The H-Q electricity supply is an order of magnitude cleaner than the Vermont supply.
http://www.hydroquebec.com/sustainable-development/energy-environme...
2017 |
|
GWh |
|
Hydropower generated |
177091 |
Purchased |
44006 |
- Hydro |
31610 |
- Wind |
9634 |
- Biomass and waste reclamation |
2021 |
- Other |
741 |
Total RE generated and purchased |
221097 |
NOTE: Gentilly-2 nuclear generating station, plus three thermal generating stations (Tracy, La Citière and Cadillac) were shut down.
Hydro-Quebec Export Electricity: H-Q net exports were 34.4 TWh/y in 2017; provided 27% of H-Q net income, or $780 million, i.e., very profitable.
H-Q export revenue was $1,651 million in 2017, or 1641/34.4 = 4.8 c/kWh.
See page 24 of Annual Report URL.
This is for a mix of old and new contracts.
Revenue = 1641
Net profit = 780
Cost = 1641 - 780 = 861
Average cost of H-Q generation = 861/34.4 = 2.5 c/kWh
GMP buys H-Q electricity, at the Vermont border, for 5.549 c/kWh, under a recent contract. GMP buys at 5.549 c/kWh, per GMP spreadsheet titled “GMP Test Year Power Supply Costs filed as VPSB Docket No: Attachment D, Schedule 2, April 14, 2017”.
H-Q is eager to sell more of its surplus electricity to New England and New York.
That is at least 50% less than ridgeline wind and large-scale field-mounted solar, which are heavily subsidized to make their electricity appear to be less costly than reality.
GMP sells to me at 19 c/kWh, per rate schedule. Consumers pricing for electricity is highly political. That is implemented by rate setting, taxes, fees, surcharges, etc., mostly on household electric bills, as in Denmark and Germany, etc. The rate setting is influenced by protecting “RE policy objectives”, which include highly subsidized, expensive microgrids, islanding, batteries and net metered solar and heat pumps.
http://www.hydroquebec.com/sustainable-development/energy-environme...
http://news.hydroquebec.com/en/press-releases/1338/annual-report-2917/
http://www.hydroquebec.com/data/documents-donnees/pdf/annual-report...
http://www.windtaskforce.org/profiles/blogs/green-mountain-power-co...
http://www.windtaskforce.org/profiles/blogs/increased-canadian-hydr...
Views: 843
Comment
-
Comment by Barbara Durkin on August 23, 2018 at 8:38pm
-
Sierra et al clearly don’t care where their money comes from as long as it arrives.
Public and environmental benefits are not on the horizon I gather, Willem. The assumption that wind and solar will extend benefits is what needs to be vigorously challenged as you clearly recognize.
I recall all Caps responses to comments critical of wind I made under Blogs & news articles in 2004-05-06-07.... There is a considerable difference today, voices have been raised around the world against wind & solar. The more people know about these energy sources and are exposed to them, the less willing they are to tolerate assiciated noise, blight, costs and environmental damage.
Thank You,
Barbara
-
Comment by Willem Post on August 23, 2018 at 5:56pm
-
Barbara,
The US has interfered with the internal affairs of at least 50 countries, either directly or by proxy.
NGOs are a favorite means to “promote civil society”
If a government takes measures to protect itself, it is lambasted for being undemocratic, evil, etc.
Excuses are invented to apply pressure, overt or covert.
-
-
Thank you for adding that information added, Willem. And, Russia has been linked to the Keep it in the Ground NGOs campaign they’ve allegedly funded. Russia’s last wind turbine installation was in 2013, give or take a little window dressing. It’s clear their intent is to undermine the security of our energy supply.
Its all political, not based on public interest, the energy decisions being made. Public safety threats are even being ignored by our government. But, I’m fairly certain that Putin is not only trying thru NGOs to influence energy policies in the US, he’s well aware that wind turbines cause Doppler, marine, air traffic and military’s radars interference.
Thank you, again, Willem.
-
-
Post Script to my earlier comment. These are treacherous times for citizens. Industry is too closely aligned with our governments, state & federal. Citizen’s needs conflict with industries’ needs. Until we eliminate the draining of our collective land, sea, wildlife and economic wealth, surrendered for the sole benefit of industry and their agents in government, we will be funding their exploitation, pilfering, damage & destruction.
Public subsidies attract organized criminals.
“In recent years, criminal investments focused on "renewable energy, waste collection and management, money transfers, casinos, VLT, slot machines, games and betting".
CutStill contemplating the word cartel that I suspected when I heard it, referenced in my last comment, was loaded.
Enron required government collusion, too. Special government favor allowed Enron to destroy the wrath of all except the executives who walked away with multi-millions.
“cartel” - Legal Definition. n. A group of independent producers or sellers in a particular industry, or a group of businesses with a common interest, who have joined together to reduce competition between themselves by allocating markets, sharing knowledge, or controlling the price and production of a product or service ...
Is a cartel legal in the United States?
Cartel
A combination of producers of any product joined together to control its production, sale, and price, so as to obtain aMonopoly and restrict competition in any particular industry or commodity. Cartels exist primarily in Europe, being illegal in the United States under antitrust laws. Also, an association by agreement of companies or sections of companies having common interests, designed to prevent extreme or Unfair Competition and allocate markets, and to promote the interchange of knowledge resulting from scientific and technical research, exchange of patent rights, and standardization of products.
-
-
Hi Barbara,
I have added a section on replacing gasoline with electricity.
Russia and the Middle east love the LNG shipments at 3 times domestic pipeline gas from PA.
Europe wants to see the US saddled with expensive wind and solar energy, because otherwise the US would have an economic advantage regarding trade.
http://www.windtaskforce.org/profiles/blogs/the-eu-and-internationa...
Here are some more articles for your information
http://www.windtaskforce.org/profiles/blogs/a-very-expensive-offsho...
http://www.windtaskforce.org/profiles/blogs/the-reality-of-wind-ene...
http://www.windtaskforce.org/profiles/blogs/the-true-cost-of-wind-e...
http://www.windtaskforce.org/profiles/blogs/wind-plus-solar-plus-st...
http://www.windtaskforce.org/profiles/blogs/electricity-storage-to-...
http://www.windtaskforce.org/profiles/blogs/wind-and-solar-hype-ver...
-
-
That’s a concern, Willem. The LNG scenario is news to me. I appreciate your continuing education. Years ago, at a fundraiser held by stakeholders fighting Cape Wind, there was the usual Q&A following presentations. A man asked, “Does anyone know anything about the cartel behind Cape Wind?” “Cartel”?!? What did He know about it? I had my own concerns as the late Senator Kennedy had previously identified to fellow Senators on the Senate floor that we knew nothing about Cape Wind, EMI, Wind Managent LLC. I approached the man who mentioned cartel afterwards and provided him with my knowledge of partnerships. I was caught off guard whe he became angry, visibly dark. I later Googled him and learned he was an exec with GDF Suez, a mole I suppose. He must have known what you know and your explanation has helped me to understand more clearly. Offshore wind is an LNG bonanza!
Massachusetts “feel good” renewable misadventure condemns rate & taxpayers. New England Governs continue to mess with our energy markets at our expense. They rely on wind companies’ advice & stategies to address climate hysteria.
A couple of years ago, a former House Speaker complimented me when I spoke publicly about offshore wind. “You’re a walking encyclopedia on offshore wind.” I thanked him and continued on to say that the MA energy market was restructured 7 times to favor renewables under the Patrick Administation. I complained that most of these public officials left office to join the renewable sector their enacted regulations force us to buy & subsidize. Former Speaker responded, “We only serve for four years. We have to have a plan for when we leave office.” I’m not sure if he was intentionally attempting to antagonize me, or if he was oblivious to the Regulatory Capture I had described. When he left office I do know it was because he had been convicted of public fraud.
The stakes are high with the ala carte’ offshore wind mandates. Many of them authored by First Wind CEO as former Gov Patrick’s appointed Advisor on green policies to the Secretary of energy. That’s even while DAs from 8 New York State counties had been “bombarded” with complaints about UPC First Wind under investigation by Cuomo’s office.
During March of 2011, First Wind CEO, as Advisor to MA energy secretary on green mandates, was identified by his project’s hosts in Hawaii as “The Hawaii Wind Developer tied to Largest-ever asset seizure by anti-Mafia police’.
http://www.hawaiifreepress.com/ArticlesMain/tabid/56/ID/4008/Hawaii...
We are already burdened by onerous green policies, and we’re swamped by debt identified as “savings”.On July 2, 2008, the Green Communities Act was signed by then Governor Deval Patrick. To the crowd gathered at the Boston Museum of Science Patrick stated, “The act is a comprehensive energy reform bill that resulted from close collaboration with House Speaker Salvatore DiMasi and Senate President Therese Murray. The bill, which sets a new national standard in energy policy, was filed by Speaker DiMasi in 2007…”[The Act]...“will reduce electric bills”.However, Attorney General Martha Coakley testified to legislators during the fall of 2011 that the Green Communities Act implemented over (only) four years, created a $4 billion dollar ratepayer premium.DiMasi’s Green Communities Act ratepayer premium of $4 billion did not include Cape Wind’s green energy tax of $4.08 billion. ‘The True Cost of Cape Wind’ Executive Summary by W. Robert Patterson & Associates provides Cape Wind’s, “Green Energy Tax to Customers: $4.08 Billion”.DiMasi was also convicted of public fraud as MA House Speaker, and sentenced to an 8 yr prison term.Thanks again, Willem, for your efforts to educate us.Barbara
-
-
Barbara,
US offshore wind will be bonanza for Europeans, as well as for Russia and the Middle East provideing huge quantities of LNG for decades at 3 times the cost of domestic gas from Pennsylvania.
See Apppendix 6 for what is required to electricify just the vehicles on gasoline; 124 tanker loads, plus the 68 for replacing the nuclear plants with gas turbines, for a total of 192 tanker loads.
Those folks in Massachusetts do not have a clue of what is required, spouting bromades like “wind correlates very well with cold periods”. When I saw this I almost vomited. If I had said that to my professor at RPI, he would have awarded me a D on the spot.
I have not yet calculated replacing fuel, propane, etc., with electricity for heat pumps. It will require many tanker loads.
Always remember wind and solar can BOTH be zero AT ANY TIME OF THE YEAR FOR MANY HOURS OF THE YEAR.
-
-
Great offering as always, Willem. Thank you.
It’s very troubling that the offshore wind program lacks cost details and is being presented as savings.
A reporter informed me recently that their editor omitted his reference to significantly higher cost, instead parroting developer’s cost savings hype. Wash repeat. This New England Gov’s plan is a piece meal program. Wait until they wrap new subsea transmission costs around offshore wind @ $6 mil estimated per mile. As insurance industry sources provide 80% of offshore wind claims pertain to cable failure, with each repair cost averaging $6.4 million.
See a list, next link, beginning on page 161 of 220. BOEM is well aware of offshore wind cable failure impacting projects they list. https://www.bsee.gov/sites/bsee.gov/files/tap-technical-assessment-...
Oh yes, add ports’ upgrades, US flagged purpose vessels...
Another concern is Offshore wind renewable energy credits, ORECs. These must Not be sold separated from energy in order to avoid prevalent fraud.
https://www.utilitydive.com/news/nextera-drops-vermont-recs-adding-...
This article informs us about the need for transmission, which I’ve read amounts to 3,000 miles, (MA needs 90 miles). —-
$$$
‘Anbaric Pushes Offshore Grid Plans’
July 22, 2018
By Michael Kuser
While the U.S. is keen to benefit from the declining costs of developing offshore wind energy, it appears less focused on learning how the industry matured in Europe, where it was pioneered in 1991. That’s the assessment of two industry experts who, admittedly, have a stake in the issue. “We see [regulators] focusing on the generation resource and assuming the transmission is going to be there, and not providing for the transmission necessary to get to scale,” said Stephen Conant, partner with Anbaric Development Partners, an independent transmission company.
Cut/
https://www.rtoinsider.com/anbaric-offshore-wind-96507/
PS. There’s always a little bit of this for that... It helps to have “connections”. See Cuomo’s office, here: Go back to 2015.
‘Top energy regulator tied to bidders for state work’
By SCOTT WALDMAN 06/16/2015 05:21 AM EDT “ALBANY—
As New York’s top energy regulator, Audrey Zibelman is in a position to influence a market worth billions of dollars and help set the policy that governs it.” Cut more/ She recently recused herself, after a question from a newspaper reporter, from a decision that could benefit a separate energy company she’s connected to through a series of overlapping corporate boards and financial backers. The company, Anbaric, has billions of dollars in potential transmission and microgrid projects pending before the state and was founded by her former business partner at Viridity, Edward Krapels. (An Anbaric website describes Viridity as a “collaborator.”)
Cut/continue reading- https://www.politico.com/states/new-york/albany/story/2015/06/top-e...
Cuomo’s PUC Chair departed in 2017. Damage is done. Relationships & policies have already formed. Anbaric is now helping MA to tweak legislation to wrap the cost of their transmission around the triple current cost of offshore wind. Our cost, $ billions to spend $ billions.
Do tell...by a no bid deal?
Thank You,
Barbara Durkin
-
-
Thank you.
Please distribute to your contacts.
-
Comment by Steve Thurston on August 16, 2018 at 2:54pm
-
Great work Willem! Thanks for your vigilance and dedication to the truth.
Maine as Third World Country:
CMP Transmission Rate Skyrockets 19.6% Due to Wind Power
Click here to read how the Maine ratepayer has been sold down the river by the Angus King cabal.
Maine Center For Public Interest Reporting – Three Part Series: A CRITICAL LOOK AT MAINE’S WIND ACT
******** IF LINKS BELOW DON'T WORK, GOOGLE THEM*********
(excerpts) From Part 1 – On Maine’s Wind Law “Once the committee passed the wind energy bill on to the full House and Senate, lawmakers there didn’t even debate it. They passed it unanimously and with no discussion. House Majority Leader Hannah Pingree, a Democrat from North Haven, says legislators probably didn’t know how many turbines would be constructed in Maine if the law’s goals were met." . – Maine Center for Public Interest Reporting, August 2010 https://www.pinetreewatchdog.org/wind-power-bandwagon-hits-bumps-in-the-road-3/From Part 2 – On Wind and Oil Yet using wind energy doesn’t lower dependence on imported foreign oil. That’s because the majority of imported oil in Maine is used for heating and transportation. And switching our dependence from foreign oil to Maine-produced electricity isn’t likely to happen very soon, says Bartlett. “Right now, people can’t switch to electric cars and heating – if they did, we’d be in trouble.” So was one of the fundamental premises of the task force false, or at least misleading?" https://www.pinetreewatchdog.org/wind-swept-task-force-set-the-rules/From Part 3 – On Wind-Required New Transmission Lines Finally, the building of enormous, high-voltage transmission lines that the regional electricity system operator says are required to move substantial amounts of wind power to markets south of Maine was never even discussed by the task force – an omission that Mills said will come to haunt the state.“If you try to put 2,500 or 3,000 megawatts in northern or eastern Maine – oh, my god, try to build the transmission!” said Mills. “It’s not just the towers, it’s the lines – that’s when I begin to think that the goal is a little farfetched.” https://www.pinetreewatchdog.org/flaws-in-bill-like-skating-with-dull-skates/
Not yet a member?
Sign up today and lend your voice and presence to the steadily rising tide that will soon sweep the scourge of useless and wretched turbines from our beloved Maine countryside. For many of us, our little pieces of paradise have been hard won. Did the carpetbaggers think they could simply steal them from us?
We have the facts on our side. We have the truth on our side. All we need now is YOU.
“First they ignore you, then they laugh at you, then they fight you, then you win.”
-- Mahatma Gandhi
"It's not whether you get knocked down: it's whether you get up."
Vince Lombardi
Task Force membership is free. Please sign up today!
Hannah Pingree on the Maine expedited wind law
Hannah Pingree - Director of Maine's Office of Innovation and the Future
"Once the committee passed the wind energy bill on to the full House and Senate, lawmakers there didn’t even debate it. They passed it unanimously and with no discussion. House Majority Leader Hannah Pingree, a Democrat from North Haven, says legislators probably didn’t know how many turbines would be constructed in Maine."
https://pinetreewatch.org/wind-power-bandwagon-hits-bumps-in-the-road-3/
© 2026 Created by Webmaster.
Powered by
![]()
You need to be a member of Citizens' Task Force on Wind Power - Maine to add comments!
Join Citizens' Task Force on Wind Power - Maine