GLOBAL WARMING IN VERMONT; very little in summer, somewhat more in winter, based on 40 years of NOAA station data
GLOBAL WARMING IN VERMONT; very little in summer, somewhat more in winter, based on 40 years of NOAA station data
https://www.windtaskforce.org/profiles/blogs/global-warming-in-vermont
By Willem Post.
.
The beautiful graphs are by Willis Eschenbach. See URL
.
Summer
Each year has peak temperatures during the summer months June, July, August. The below graph shows those peak temperatures in Vermont, for about 40 years.
Those temperatures were measured by the weather stations in Vermont of the National Oceanic and Atmospheric Administration, NOAA
Vermont has four weather stations; Burlington, St Johnsbury, Castleton and Windsor.
New Hampshire also has four stations
The peak temperatures increased by 1.5 F over 40 years, or 0.0375 F per year.
Almost all people cannot sense the difference of 77 F and 78.5 F
Winter
A similar graph shows the minimum temperatures during the months of December, January, February
The minimum temperatures increased by 4.2 F over 40 years, or 0.1 F per year. Most older Vermonters agree, winters in Vermont have been getting warmer.
Heating demand is driven by temperature difference, which was about (65 F, indoor - 9.8 F, outdoor = 55.2 F) in 1980, and became (65 F, indoor - 14 F outdoor) = 51 F in 2020
At present, it takes 7.6% less Btu for space heating a house than 40 years ago.
Vermonters Being Screwed/Impoverished by Climate Idiots
Already-struggling, over-taxed, over-regulated Vermonters, in a low/near-zero, real-growth Vermont economy, would be required to spend at least $1.5 billion per year (during high inflation and high interest times), starting in January 2023, for the next 27 years, to maybe reduce Vermont CO2 emissions to the 2050 target of the VT Comprehensive Energy Plan.
That extreme hardship spending would have ZERO impact on temperatures in Vermont, which is a near-invisible pinprick on a world map.
Vermont’s best approach is to be as energy efficient as economically feasible regarding:
1) Highly sealed/insulated housing
2) High-mileage gasoline vehicles
3) Closing down the less-than-25%-efficient, tree-burning power plants (the energy equivalent of 3 out 4 trees is wasted), such as McNeil and Ryegate.
Tree-burning power plants and heating plants/stoves are major contributors to Vermont’s CO2 and ground level air pollution from sub-micron particles, which are as toxic as those of coal burning, and most harmful to people, especially pregnant women, children, elderly, and those with cardio/vascular ailments.
.
These small temperature changes were exploited by climate scare-mongers finally admitting to DECADES of weather modification.
https://www.youtube.com/watch?v=djBl2SM-BVI
.
APPENDIX
Thermometer record shows global warming starting long before the 1950’s
We had warming from the 1910’s to the 1940’s, and then cooling from the 1940’s to the 1970’s, and then warming from the 1980’s into the 2000’s, where the temperatures have peaked, as they did in the 1930’s, and now a cooling trend has appeared.
.
Here’s the U.S. chart (Hansen 1999) showing warming and cooling before 1979, and then the UAH satellite chart showing the warming and cooling from 1979 to present.
.
As you can see, there was warming in North America in the recent past.
You don’t have to go back hundreds or thousands of years to find a period that was just as warm, or warmer, than today.
The Early Twentieth Century was just as warm as today, as recorded in numerous written temperature charts from all over the world.
Hansen chart of 1999:

University of Alabama, Huntington Campus
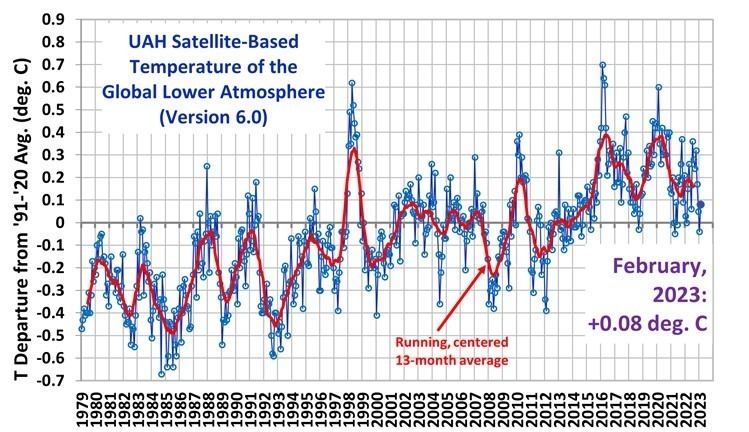
Combined, these two charts represent the real temperature profile of the Earth, where it was just as warm in the recent past as it is today.
The CO2 has had no visible effect on temperatures
There is much more CO2 is in the air today, than was in the air in the Early Twentieth Century, yet it is no warmer today that it was then.
This is the BIG LIE the climate-change alarmists tell.
It is refuted by the written temperature record, which is available to just about anyone who cares to look.
One has to wonder why all the alarmist experts, and some of those on the skeptic side, continue to ignore the Early Twentieth Century, and the bastardization that has taken place to erase the Early Twentieth Century from memory.
The written temperature record and the Early Twentieth Century temperatures repudiate the Catastrophic Anthropogenic Global Warming (CAGW) claims of the Alarmists.
That’s all you need, as proof that CO2 has no discernible effect on the Earth’s atmosphere.
Almost 100 years of increased CO2 going into the atmosphere, yet it is no warmer today than it was then.
Climate models, like the ones that the EPA is using, have been consistently wrong for decades in predicting actual outcomes, Mr. Happer told The Epoch Times. He presented the table below to the EPA to illustrate his point.
.
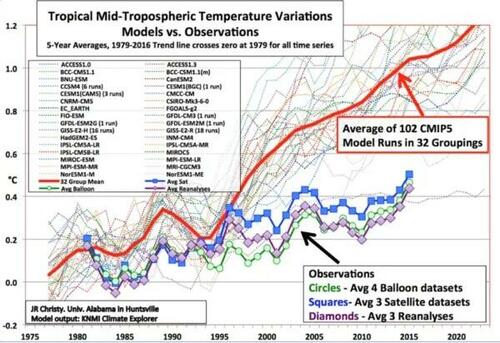
Modeled climate predictions (average shown by red line) versus actual observations (source: J.R. Christy, Univ. of Alabama; KNMI Climate Explorer)
.
“That was already an embarrassment in the ‘90s, when I was director of energy research in the U.S. Department of Energy,” he said. “I was funding a lot of this work, and I knew very well at that time, the models were over-predicting the warming by a huge amount.”
.
He and his colleague argued, the EPA has grossly overstated the harm from CO2 emissions, while ignoring the benefits of CO2 to life on Earth.
What’s left to say?
CO2 is a Life Gas; No CO2 = No Flora and Fauna
https://www.windtaskforce.org/profiles/blogs/co2-is-a-life-gas-no-c...
Lying with Statistics
The first image shows the temperature increase in a human scale, from 1880 to 2020
The increase is barely visible.
It could be due to coming out ofc the Little Ice Age, or CO2, or increased urbanization
The second image shows the same data on a greatly magnified vertical scale.
Central England Temperatures
This is the longest continuous temperature record with a thermometer.
CO2 increased exponentially, but Central England temperatures did not respond at all.
CO2 was about constant from 1559 to 1850
CO2 has been increasing since 1855
A one degree C temperature increase from 1659 to 2009, does not come close to the increase in CO2.
There was a temperature increase from about 1720 to about 1736, while CO2 remained constant.
There was a smaller increase from about 1988 to about 2009, which cannot be attributed to CO2.
.
Views: 408
Comment
-
Comment by Frank Haggerty on September 21, 2025 at 11:51am
-
'Conspiracy theorists' VINDICATED as climate activists admit to DECADES of 'weather modification
https://www.youtube.com/watch?v=djBl2SM-BVI
Maine as Third World Country:
CMP Transmission Rate Skyrockets 19.6% Due to Wind Power
Click here to read how the Maine ratepayer has been sold down the river by the Angus King cabal.
Maine Center For Public Interest Reporting – Three Part Series: A CRITICAL LOOK AT MAINE’S WIND ACT
******** IF LINKS BELOW DON'T WORK, GOOGLE THEM*********
(excerpts) From Part 1 – On Maine’s Wind Law “Once the committee passed the wind energy bill on to the full House and Senate, lawmakers there didn’t even debate it. They passed it unanimously and with no discussion. House Majority Leader Hannah Pingree, a Democrat from North Haven, says legislators probably didn’t know how many turbines would be constructed in Maine if the law’s goals were met." . – Maine Center for Public Interest Reporting, August 2010 https://www.pinetreewatchdog.org/wind-power-bandwagon-hits-bumps-in-the-road-3/From Part 2 – On Wind and Oil Yet using wind energy doesn’t lower dependence on imported foreign oil. That’s because the majority of imported oil in Maine is used for heating and transportation. And switching our dependence from foreign oil to Maine-produced electricity isn’t likely to happen very soon, says Bartlett. “Right now, people can’t switch to electric cars and heating – if they did, we’d be in trouble.” So was one of the fundamental premises of the task force false, or at least misleading?" https://www.pinetreewatchdog.org/wind-swept-task-force-set-the-rules/From Part 3 – On Wind-Required New Transmission Lines Finally, the building of enormous, high-voltage transmission lines that the regional electricity system operator says are required to move substantial amounts of wind power to markets south of Maine was never even discussed by the task force – an omission that Mills said will come to haunt the state.“If you try to put 2,500 or 3,000 megawatts in northern or eastern Maine – oh, my god, try to build the transmission!” said Mills. “It’s not just the towers, it’s the lines – that’s when I begin to think that the goal is a little farfetched.” https://www.pinetreewatchdog.org/flaws-in-bill-like-skating-with-dull-skates/
Not yet a member?
Sign up today and lend your voice and presence to the steadily rising tide that will soon sweep the scourge of useless and wretched turbines from our beloved Maine countryside. For many of us, our little pieces of paradise have been hard won. Did the carpetbaggers think they could simply steal them from us?
We have the facts on our side. We have the truth on our side. All we need now is YOU.
“First they ignore you, then they laugh at you, then they fight you, then you win.”
-- Mahatma Gandhi
"It's not whether you get knocked down: it's whether you get up."
Vince Lombardi
Task Force membership is free. Please sign up today!
Hannah Pingree on the Maine expedited wind law
Hannah Pingree - Director of Maine's Office of Innovation and the Future
"Once the committee passed the wind energy bill on to the full House and Senate, lawmakers there didn’t even debate it. They passed it unanimously and with no discussion. House Majority Leader Hannah Pingree, a Democrat from North Haven, says legislators probably didn’t know how many turbines would be constructed in Maine."
https://pinetreewatch.org/wind-power-bandwagon-hits-bumps-in-the-road-3/
© 2026 Created by Webmaster.
Powered by
![]()
You need to be a member of Citizens' Task Force on Wind Power - Maine to add comments!
Join Citizens' Task Force on Wind Power - Maine