CARBON DIOXIDE: A POLLUTANT KILLING US ALL, OR THE FOOD OF LIFE? YOU BE THE JUDGE.
CARBON DIOXIDE: A POLLUTANT KILLING US ALL, OR THE FOOD OF LIFE? YOU BE THE JUDGE.
https://www.windtaskforce.org/profiles/blogs/carbon-dioxide-a-pollu...
by David H Denham
.
For over thirty years, we have all been bombarded by the rhetoric that our future is doomed.
The Earth is “Boiling”, the oceans are rising, everything which could possibly go wrong with our planet is “ About to Happen”, “Any Minute”, “Won’t be Long Now”, we all face “Catastrophic Extinction”, and man-made Carbon Dioxide is the culprit.
However, the huge problem for the scare-mongers, it is not happening. At all! Not even a bit!
Sure, weather and other events are still occurring, some a little weird, but the promises of doom just haven’t eventuated.
.
In spite of Al Gore’s predictions, the Arctic Winter Ice cap and the Northern Glaciers have been surprisingly healthy over the past few decades.
And although the Antarctic sea ice has fluctuated a little as the oceans continue their warming trend, which was predicted after the lag following the Little Ice Age late last millennium, snow volumes in Antarctica continue to bury the Ice Stations, with cold records being broken regularly and with overall cooling, particularly on the giant Eastern and Western plateaus.
.
The global surface, below water and above water, is flexible, and floats, as tectonic plates, on a molten core of iron.
That surface moves up in some places and down in other places.
Such surface movements affect water levels measured by tide gauges, which means over time, the differences between tide gauge readings have little to with increased quantities of water, but with slowly changing surface levels. See four examples:
.
1) Global Average ocean levels have barely risen by 170 mm in a century (not accounting for surface changes).
2) Pacific Islands have actually grown in gross area over the past 30 years, with Tuvalu showing a 2.3% land area increase; likely has a rising surface
3) The Maldives have shown no tidal rises in the last 4 decades; lower surface offsets water quantity increase
4) Our own static sea level site at Fort Dennison in Sydney Harbor, shows a net rise of only 80 mm in 125 years; likely has a rising surface
.
Tornadoes, hurricanes, droughts, bushfires and floods are all recording average decreases over 120 years, and even Polar Bear and Emperor Penguin populations are soaring.
.
Global average temperatures have increased by about 0.8 C over the last 140 years.
At least they had up until the Hunga Tonga sub-oceanic volcano blew about 146 million tonnes of water vapor, water droplets and icicles into the Stratosphere in 2022.
.
The doom-saying ideologues were ecstatic, as we got a small temperature bounce from the “Greenhouse” effect of upper atmospheric H2O.
To the terminally woke, this was great news, as the planet had been beginning to cool for some years heading into another Grand Solar Minimum from low Sunspot activity.
This cooling is according to many scientists who excel in this field.
Those scientists have also told us that this excess water will disperse within the next few years, and the cooling trend will resume.
.
As always, natural events like changes in water vapor, plus the sunspot activity of the Sun, the cyclic currents of our great oceans, volcanic activity, both above and beneath the surface of the sea, ice cap movements in the Arctic, the Milankovitch Cycles of the Earth around the Sun, and a myriad of other natural phenomena, all contribute to our climate and our temperatures.
.
But what has Carbon Dioxide contributed along with all of these other influences to our planet’s climate?
What has this scarce, trace gas been doing to temperatures as they have followed their erratic course over the millennia?
One thing is absolutely certain.
As we have been able to determine accurate historical values of both CO2 and H20 over history, Carbon Dioxide has been shown empirically to have NEVER dictated the temperature of our planet.
.
We have seen the graphs going back over 400 Million years, showing Carbon Dioxide and Temperature values without any correlation.
But then 20 years ago, a study of the 400,000-year-old Vostok Ice Cores from the Antarctic seemed to show a CO2 leading temperature
The IPCC trumpeted these results:…….“Man-made Carbon Dioxide is Catastrophically Warming our Planet”……. .
Unfortunately, many scientific teams consequently studied the cores to discover that there was a lag showing CO2 lagged temperature, by 400 to 5000 years..
Oh dear…..
And studies of the Holocene over the last 12,000 years, have verified this as well.
The Holocene had early temperatures from 2 C to 4 C hotter than today, according to the Danish Meteorological Institute, except during the Little Ice Age which started about 1400 and ended around 1850 - 1875, during which one third of the world’s population died from disease, starvation and cold.
And what was CO2 doing over this cold period? It was rising gradually from 180 to 280 molecules of CO2 per million molecules of dry air, as the Earth cooled. Totally out of sync.
.
The ideologues desperately tried to relate rises in CO2 late last century with two decades of small rises in world temperatures, but Carbon Dioxide again demonstrated no relatable impact on temperatures.
.
Flora and Fauna Need More CO2, at least 1000 ppm
Plants require at least 1000 to 1200 ppm of CO2, as proven in greenhouses
Many plants have become extinct, along with the fauna they supported, due to a lack of CO2. As a result, many areas of the world became arid and deserts. Current CO2 needs to at least double or triple. Earth temperature increased about 1.2 C since 1900, due to many causes, such as fossil CO2, and permafrost methane which converts to CO2.
.
CO2 ppm increased from 1979 to 2023 was 421 - 336 = 85, greening increase about 15%, per NASA.
CO2 ppm increased from 1900 to 2023 was 421 - 296 = 125, greening increase about 22%
Increased greening: 1) Produces oxygen by photosynthesis; 2) Increases world fauna; 3) Increases crop yields per acre; 4) Reduces world desert areas
The ozone layer absorbs 200 to 315 nm UV wavelengths, which would genetically damage exposed lifeforms.
.
Energy-related CO2 was 37.55 Gt, or 4.8 ppm in 2023, about 75% of total human CO2.
One CO2 ppm in atmosphere = 7.821 Gt. Total human CO2 was 4.8/0.75 = 6.4 ppm in 2023. See URLs
To atmosphere was CO2 was 421.08 ppm, end 2023 - 418.53, end 2022 = 2.55 ppm; natural increase is assumed zero; to oceans 2.50 ppm (assumed); to flora and other sinks 1.35 ppm
Mauna Loa curve shows a variation of about 9 ppm during a year, due to seasonal variations.
Inside buildings, CO2 is about 1000 ppm, greenhouses about 1200 ppm, submarines up to 5000 ppm
.
Respiration: glucose + O2 → CO2 + H20 (+ energy)
Photosynthesis: 6 CO2 + 12 H2O (+ sunlight+ chlorophyll) → 1 glucose + 6 O2 + 6 H20
Plants respire 24/7. Plants photosynthesize with brighter light
In low light, respiration and photosynthesis are in balance
In bright light, photosynthesis is much greater than respiration
https://gml.noaa.gov/webdata/ccgg/trends/co2/co2_annmean_mlo.txt
https://www.windtaskforce.org/profiles/blogs/new-study-2001-2020-gl...
http://wattsupwiththat.com/2015/05/05/anthropogenic-global-warming-...
https://www.windtaskforce.org/profiles/blogs/summary-of-world-co2eq...
https://issuu.com/johna.shanahan/docs/co2_pitch_4-3-24_baeuerle_eng...
.
But what is the actual truth? Celebrities, Royalty, Politicians, heavily funded minor “scientists”, (small s), and others bereft of scientific reality, tell us the DOOMSDAY clock is ticking .
Are they right? Could all of our observations be wrong? Let’s take a look at some “Real Science”.
.
Fact: The Intergovernmental Panel on Climate Change tell us Carbon Dioxide has the worst Global Warming Potential (GWP) of any compound in their list of 86 compounds.
It is rated as 1.
So, take for example Sulphur Hexafluoride (SF6) with a GWP of 22,800. You would need 22,800 molecules of CO2 to equal the GWP of 1 molecule of SF6
.
Fact: CO2 absorbs only a tiny portion of the full spectrum of re-radiated heat from the surface of our planet, mostly at a frequency of 14.8 micrometers, but it cannot hold its "excited state".
It re-emits a photon, at a longer wavelength, within microseconds, in all directions.
.
Fact: The CO2 absorption effect is finished at about 3 meters above the Earth’s surface.
Doubling its current ppm in the atmosphere will have no discernible effect.
.
Fact: Water can absorb nearly the full spectrum of re-radiated heat, from 2 to 30 micrometers.
And it CAN hold the heat. (We all have boiled kettles).
Because of its ability to manage energy through changes of state from ice, to water, to vapor, and back again, and by its huge abundance of water vapor in the atmosphere, water vapor is the main control knob for all of our climate.
We see it in our clouds up to thousands of meters, and we feel it in the humidity or lack thereof.
Carbon Dioxide doesn’t even score by comparison.
.
Fact: The radiant energy from the Sun can penetrate the ocean and land surface just a few micrometers.
A large part of the radiant energy is reflected.
Water is mainly heated by radiant energy, which cause warming and evaporation, and cloud formation as the vapor rises.
.
Fact: The transmission of energy is a function of volume or quantity.
CO2 in atmosphere, natural and human sources = 420 ppm x 7.821 Gt/ppm = 3285 Gt
Humans emit about 36 Gt CO2/y in 2023.
We know about 50% is absorbed by the oceans or biomass. Say 18 Gt.
Human CO2 addition to the atmosphere in 2023 was 100% x 18/3285 = 0.55%
.
Fact: Termites emit large quantities of methane, carbon dioxide, and molecular hydrogen into the atmosphere. Global annual emissions, calculated from laboratory measurements, are about 1.5 × 10¹⁴ grams of methane and 5 × 10¹⁶ grams of CO2, or 50 Gt of CO2.
Termites, worms, and other critters chew and excrete, and thereby promote decay of biomass, which emits methane, which converts to CO2, due to sunlight.
Everything that dies/decays emits methane, so when the earth comes out of a cold period, biomass and critters increase, decay increases, methane increases, which converts to CO2, which lags temperature, as proven by ice-cores.
.
Fact: Photons have energy, but no mass, move at the speed of light in a vacuum.
At 15 C, about 7% of photons emitted by the surface have wavelengths of 14.8 micrometers, which can be absorbed by abundant water vapor, 15000 ppm near the surface, and by much scarcer CO2, 420 ppm near the surface.
Abundant WV can also absorb surface photons of different wavelengths, from 2 to 30 micrometers, via many of its large windows.
Scarce CO2 can absorb surface photons of different wavelengths, but at a much lesser level, because CO2 has fewer and smaller windows than WV.
The remaining surface photons, less than 93%, thermalize by collisions (disappear by transferring their energy) with hugely abundant air molecules near the surface, thereby warming the air and WV by conduction near the surface.
The slightly warmed air and warmed water vapor rise, expand (become less dense) and cool as they rise (at about 5.5 - 6 C/km, with stable conditions, up to 9 C/km with unstable conditions), and usually form clouds starting at about 2000 meters.
Any re-radiation photons in all directions by the atmosphere will be at greater than 14.8 micrometer, beyond the major CO2 window, but not beyond the WV windows.
But WV ppm significantly decreases at higher elevations. The upshot is those photons are thermalized by collisions with abundant air molecules.
The warming and rising process continues after the sun sets, until it reaches a low-point at about 5 am, after which it starts over again, as the sun rises
As the sun rises:
.
1) its high-energy photons slightly warm the air above any ground fog. These photons thermalize by collision with air molecules. The warmed air emits low energy photons with wavelengths longer than 14.8 micrometer in all directions.
2) then, the sun's high-energy photons slightly warm any ground fog. The warmed fog rises and emits low energy photons in all directions
3) then, the sun's high-energy photons warm the surface after penetrating any remaining fog. The surface emits low energy photons
All surface photons are thermalized less than 10 m off the surface
.
O2 and N2, together more than 99% of the atmosphere, absorb energy from low energy photons more weakly than CO2 and CH4
They do not have a negligible role in Earth’s greenhouse effect, because N2 is 2000 times more abundant, and O2 is 550 times more abundant, than CO2.
Based on basic physics, no special role can be assigned to CO2, or any of the trace gases.
.
Every day, we have global warming and cooling of the surface of 10 to 20 C; see your outdoor thermometer.
These URLs have more detailed information
https://www.windtaskforce.org/profiles/blogs/hunga-tonga-volcanic-eruption
https://www.windtaskforce.org/profiles/blogs/natural-forces-cause-p...
.
Summary of Statements by Well-Known Entities
However, if you are still unsure about what has been presented here, but you don’t wish to see our rainforests and precious wildlife destroyed by the monstrous invasion of wind, solar and batteries, or if you are unhappy at the huge increases in energy costs, and are fearful of the continued destruction of our economy, just read the following quotes. They should remove any doubts.
.
*From The Club of Rome. (Among other “nefarious” roles, it acts as a Think Tank and Climate Consultant to the United Nations) : “The common enemy of humanity is man. In searching for a new enemy to unite us, we came up with the idea that pollution, the threat of global warming, water shortages, famine and the like would fit the bill”.
.
From Christiana Figueres, the Executive Secretary of the UN’s Framework Convention on Climate Change: “Our aim is not to save the world from ecological calamity but to change the economic system….This is probably the most difficult task we have ever given ourselves, which is to transform the economic development model for the first time in human history”.
In other words, to destroy Capitalism in exchange for One World Government and Economic Control.
Still doubtful? Google any of the speeches from the World Economic Forum in ’22 or ’23.
.
From Timothy Wirth, President of the UN Foundation: “We’ve got to ride this global warming issue. Even if the theory of global warming is wrong, we will be doing the right thing in terms of economic and environmental policy”.
.
From IPCC official Ottmar Edenhofer: “One has to free oneself from the illusion that international climate policy is environmental policy. It is not. It is actually about how we redistribute de facto the world’s wealth”.
.
From Christine Stewart, former Canadian Minister of the Environment: “No matter if the science of global warming is all phony…Climate change provides the greatest opportunity to bring about justice and equality in the world”.
.
And let the last word come from Klaus Schwab, the head of the World Economic Forum: “You vill own nothing and you vill be happy”……….. Really Klaus, really?
For Information
CARBON DIOXIDE: A POLLUTANT KILLING US ALL, OR THE FOOD OF LIFE? YOU BE THE JUDGE.
https://www.windtaskforce.org/profiles/blogs/carbon-dioxide-a-pollu...
.
Flora and Fauna Need More CO2, at least 1000 ppm
.
Plants require at least 1000 to 1200 ppm of CO2, as proven in greenhouses
Many plants have become extinct, along with the fauna they supported, due to a lack of CO2. As a result, many areas of the world became arid and deserts. Current CO2 needs to at least double or triple. Earth temperature increased about 1.2 C since 1900, due to many causes, such as fossil CO2, and permafrost methane which converts to CO2.
.
CO2 ppm increased from 1979 to 2023 was 421 – 336 = 85, greening increase about 15%, per NASA.
CO2 ppm increased from 1900 to 2023 was 421 – 296 = 125, greening increase about 22%
Increased greening: 1) Produces oxygen by photosynthesis; 2) Increases world fauna; 3) Increases crop yields per acre; 4) Reduces world desert areas
The ozone layer absorbs 200 to 315 nm UV wavelengths, which would genetically damage exposed lifeforms.
.
Energy-related CO2 was 37.55 Gt, or 4.8 ppm in 2023, about 75% of total human CO2.
One CO2 ppm in atmosphere = 7.821 Gt. Total human CO2 was 4.8/0.75 = 6.4 ppm in 2023. See URLs
To atmosphere was CO2 was 421.08 ppm, end 2023 – 418.53, end 2022 = 2.55 ppm; natural increase is assumed zero; to oceans 2.50 ppm (assumed); to flora and other sinks 1.35 ppm
Mauna Loa curve shows a variation of about 9 ppm during a year, due to seasonal variations.
Inside buildings, CO2 is about 1000 ppm, greenhouses about 1200 ppm, submarines up to 5000 ppm
.
Respiration: glucose + O2 → CO2 + H20 (+ energy)
Photosynthesis: 6 CO2 + 12 H2O (+ sunlight+ chlorophyll) → 1 glucose + 6 O2 + 6 H20
Plants respire 24/7. Plants photosynthesize with brighter light
In low light, respiration and photosynthesis are in balance
In bright light, photosynthesis is much greater than respiration
https://gml.noaa.gov/webdata/ccgg/trends/co2/co2_annmean_mlo.txt
https://www.windtaskforce.org/profiles/blogs/new-study-2001-2020-gl...
http://wattsupwiththat.com/2015/05/05/anthropogenic-global-warming-...
https://www.windtaskforce.org/profiles/blogs/summary-of-world-co2eq...
https://issuu.com/johna.shanahan/docs/co2_pitch_4-3-24_baeuerle_eng...
Unaffordable Floating Offshore Wind Systems in the Impoverished State of Maine
https://www.windtaskforce.org/profiles/blogs/floating-offshore-wind...
.
Despite the meager floating offshore MW in the world, pro-wind politicians, bureaucrats, etc., aided and abetted by the lapdog Main Media and “academia/think tanks”, in the impoverished State of Maine, continue to fantasize about building 3,000 MW of 850-ft-tall floating offshore wind turbines by 2040!!
Maine government bureaucrats, etc., in a world of their own climate-fighting fantasies, want to have about 3,000 MW of floating wind turbines by 2040; a most expensive, totally unrealistic goal, that would further impoverish the already-poor State of Maine for many decades.
Those bureaucrats, etc., would help fatten the lucrative, 20-y, tax-shelters of mostly out-of-state, multi-millionaire, wind-subsidy chasers, who likely have minimal regard for: 1) Impacts on the environment and the fishing and tourist industries of Maine, and 2) Already-overstressed, over-taxed, over-regulated Maine ratepayers and taxpayers, who are trying to make ends meet in a near-zero, real-growth economy.
Those fishery-destroying, 850-ft-tall floaters, with 24/7/365 strobe lights, visible 30 miles from any shore, would cost at least $7,500/ installed kW, or at least $22.5 billion, if built in 2023 (more after 2023)
Almost the entire supply of the Maine projects would be designed and made in Europe, then transported across the Atlantic Ocean, in European specialized ships, then unloaded at a new, $500-million Maine storage/pre-assembly/staging/barge-loading area, then barged to European specialized erection ships for erection of the floating turbines. The financing will be mostly by European pension funds.
About 500 Maine people would have jobs during the erection phase
The other erection jobs would be by specialized European people, mostly on cranes and ships
About 200 Maine people would have long-term O&M jobs, using European spare parts, during the 20-y electricity production phase.
https://www.maine.gov/governor/mills/news/governor-mills-signs-bill...
The Maine people have much greater burdens to look forward to for the next 20 years, courtesy of the Governor Mills incompetent, woke bureaucracy that has infested the state government
The Maine people need to finally wake up, and put an end to the climate scare-mongering, which aims to subjugate and further impoverish them, by voting the entire Democrat woke cabal out and replace it with rational Republicans in 2024
The present course leads to financial disaster for the impoverished State of Maine and its people.
The purposely-kept-ignorant Maine people do not deserve such maltreatment
Electricity Cost: Assume a $750 million, 100 MW project consists of foundations, wind turbines, cabling to shore, and installation at $7,500/kW.
Production 100 MW x 8766 h/y x 0.40, CF = 350,640,000 kWh/y
Amortize bank loan for $525 million, 70% of project, at 6.5%/y for 20 years, 13.396 c/kWh.
Owner return on $225 million, 30% of project, at 10%/y for 20 years, 7.431 c/kWh
Offshore O&M, about 30 miles out to sea, 8 c/kWh.
Supply chain, special ships, and ocean transport, 3 c/kWh
All other items, 4 c/kWh
Total cost 13.396 + 7.431 + 8 + 3 + 4 = 35.827 c/kWh
Less 50% subsidies (ITC, 5-y depreciation, interest deduction on borrowed funds) 17.913 c/kWh
Owner sells to utility at 17.913 c/kWh
NOTE: The above prices compare with the average New England wholesale price of about 5 c/kWh, during the 2009 – 2022 period, 13 years, courtesy of:
Gas-fueled CCGT plants, with low-cost, low-CO2, very-low particulate/kWh
Nuclear plants, with low-cost, near-zero CO2, zero particulate/kWh
Hydro plants, with low-cost, near-zero-CO2, zero particulate/kWh
.
Cabling to Shore Plus $Billions for Grid Expansion on Shore: A high voltage cable would be hanging from each unit, until it reaches bottom, say about 200 to 500 feet.
The cables would need some type of flexible support system
There would be about 5 cables, each connected to sixty, 10 MW wind turbines, making landfall on the Maine shore, for connection to 5 substations (each having a 600 MW capacity, requiring several acres of equipment), then to connect to the New England HV grid, which will need $billions for expansion/reinforcement to transmit electricity to load centers, mostly in southern New England.
Floating Offshore a Major Burden on Maine People: Over-taxed, over-regulated, impoverished Maine people would buckle under such a heavy burden, while trying to make ends meet in the near-zero, real-growth Maine economy. Maine folks need lower energy bills, not higher energy bills.
Unaffordable Floating Wind Turbines Losing Money in the UK
https://www.windtaskforce.org/profiles/blogs/unaffordable-floating-...
by Willem Post, Energy Systems Analyst
.
UK 50 MW Kincardine floating wind system was placed in service on October 2021
It produced 144 GWh in 2023
It was predicted to produce 200 GWh
CF = 144000/(8766 x 50) = 0.329, a far cry from 0.457 predicted by multi-millionaire Owners
.
Located 15 km off the coast of Aberdeenshire, Scotland, water depths 60 to 80 m
It has five Vestas V164-9.5 MW and one V80-2 MW,, each installed on WindFloat® semi-submersible platforms, designed by Principle Power.
https://www.offshorewind.biz/2021/10/19/worlds-largest-floating-off...
.
Operating results in year 2023:
All numbers are in UK pounds; $1.33 per UK pound
.
Cost = Finance 30 mil, Admin 5 mil, Other 46 mil = 81 mil
Production cost 81000000/144000 = 562/MWh
.
Income = Tax credit 6 mil, Subsidy 31 mil, Sales 13.3 mil = 50.3 mil
.
LOSS without subsidies = 81 – 13.3 = 67.7
LOSS with subsidies = 67.7 – 37 = 30.7
.
It operates under a PPA at 92/MWh and receives subsidies at 125/MWh, for a total of 217/MWh.
https://x.com/adissentient/status/1840690466477535685
.
World's first floating wind system Hywind Scotland faces shutdown for 'heavy maintenance'
https://www.windtaskforce.org/profiles/blogs/world-s-first-floating...
By Willem Post, Energy Systems Analyst
.Norway's Equinor confirms component changes needed on all five Siemens Gamesa 6MW machines operating since 2017
.
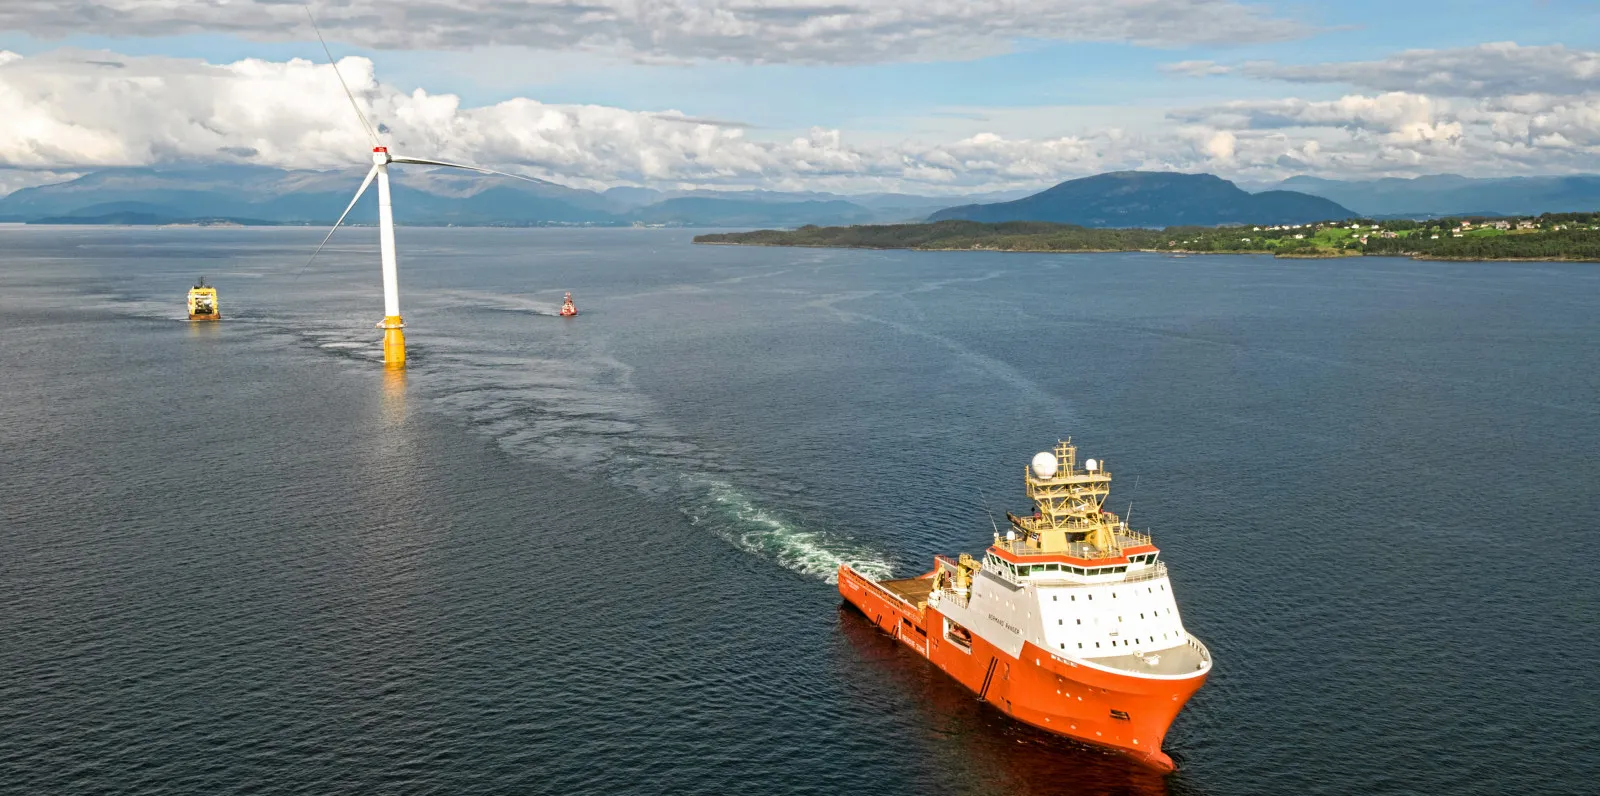
One of five 6MW Siemens Gamesa being towed out to Hywind Scotland in 2017
.
The 6MW turbines will be towed back to Wergeland on the west coast of Norway, as part of a maintenance program that is likely to take around four months and will disrupt power output from the project operating 24 km off Peterhead since 2017.
.
All units will be reconnected back on the Hywind Scotland site when the maintenance is complete, a spokesman for the Norwegian company confirmed.
Recently, Equinor decided to discontinue offshore wind projects in Spain and Portugal and had earlier pulled out of Vietnam.
Its head of renewables told Reuters, the company may consider exiting additional markets.
“It’s getting more and more expensive and we think things are going to take more time in quite a few markets around the world”
https://www.offshore.wind.biz/2024/08/29/equinor-axes-offshore-wind...
.
NOTE:
In Maine, the leftist, woke, Socialists will never stop with their unaffordable, environmental damaging, floating wind turbine wet dream, unless subsidies are reduced to ZERO
Plus, what they do not mention, to purposely keep lay people uninformed, CO2 is a life gas for growing ALL fauna and flora, including crops, on Earth.
.
CO2 ppm and TEMPERATURES are near the lowest level they have been for about 600 million years
Net Zero leads to economic strangulation and CO2 suicide
There is not enough fossil fuel left for CO2 ever to be any problem
.
All this is well known to the IPCC, and complicit entities, but they continue to blame, with help of the lapdog corporate media, CO2 ppm (0.042% of the atmosphere) for all ills, a big flood here, a big wind there, whereas abundant water vapor is at least 100 times more important regarding maintaining a livable earth.
https://www.windtaskforce.org/profiles/blogs/natural-forces-cause-p...
https://www.windtaskforce.org/profiles/blogs/hunga-tonga-volcanic-e...
Views: 104
Comment
-
Comment by Dan McKay on September 28, 2024 at 7:06am
-
The science of C02 is simple. During warming periods, C02 in the atmosphere increases. Climate change precedes C02 changes. Warming intices more bacterial activity.
Maine as Third World Country:
CMP Transmission Rate Skyrockets 19.6% Due to Wind Power
Click here to read how the Maine ratepayer has been sold down the river by the Angus King cabal.
Maine Center For Public Interest Reporting – Three Part Series: A CRITICAL LOOK AT MAINE’S WIND ACT
******** IF LINKS BELOW DON'T WORK, GOOGLE THEM*********
(excerpts) From Part 1 – On Maine’s Wind Law “Once the committee passed the wind energy bill on to the full House and Senate, lawmakers there didn’t even debate it. They passed it unanimously and with no discussion. House Majority Leader Hannah Pingree, a Democrat from North Haven, says legislators probably didn’t know how many turbines would be constructed in Maine if the law’s goals were met." . – Maine Center for Public Interest Reporting, August 2010 https://www.pinetreewatchdog.org/wind-power-bandwagon-hits-bumps-in-the-road-3/From Part 2 – On Wind and Oil Yet using wind energy doesn’t lower dependence on imported foreign oil. That’s because the majority of imported oil in Maine is used for heating and transportation. And switching our dependence from foreign oil to Maine-produced electricity isn’t likely to happen very soon, says Bartlett. “Right now, people can’t switch to electric cars and heating – if they did, we’d be in trouble.” So was one of the fundamental premises of the task force false, or at least misleading?" https://www.pinetreewatchdog.org/wind-swept-task-force-set-the-rules/From Part 3 – On Wind-Required New Transmission Lines Finally, the building of enormous, high-voltage transmission lines that the regional electricity system operator says are required to move substantial amounts of wind power to markets south of Maine was never even discussed by the task force – an omission that Mills said will come to haunt the state.“If you try to put 2,500 or 3,000 megawatts in northern or eastern Maine – oh, my god, try to build the transmission!” said Mills. “It’s not just the towers, it’s the lines – that’s when I begin to think that the goal is a little farfetched.” https://www.pinetreewatchdog.org/flaws-in-bill-like-skating-with-dull-skates/
Not yet a member?
Sign up today and lend your voice and presence to the steadily rising tide that will soon sweep the scourge of useless and wretched turbines from our beloved Maine countryside. For many of us, our little pieces of paradise have been hard won. Did the carpetbaggers think they could simply steal them from us?
We have the facts on our side. We have the truth on our side. All we need now is YOU.
“First they ignore you, then they laugh at you, then they fight you, then you win.”
-- Mahatma Gandhi
"It's not whether you get knocked down: it's whether you get up."
Vince Lombardi
Task Force membership is free. Please sign up today!
Hannah Pingree on the Maine expedited wind law
Hannah Pingree - Director of Maine's Office of Innovation and the Future
"Once the committee passed the wind energy bill on to the full House and Senate, lawmakers there didn’t even debate it. They passed it unanimously and with no discussion. House Majority Leader Hannah Pingree, a Democrat from North Haven, says legislators probably didn’t know how many turbines would be constructed in Maine."
https://pinetreewatch.org/wind-power-bandwagon-hits-bumps-in-the-road-3/
© 2026 Created by Webmaster.
Powered by
![]()
You need to be a member of Citizens' Task Force on Wind Power - Maine to add comments!
Join Citizens' Task Force on Wind Power - Maine