Rapidly rising temperatures and drought in parts of central Europe are caused by a long-term trend of receding cloud cover. Fewer clouds result in increased solar energy influx and reduced downpour. Both factors lead to higher temperatures. By comparison, the influence of CO2 levels is minimal at best.
By Fred F. Mueller
Preceding chapters see part 1 1), part 2 2), part 3 3), part 4 4), part 5 5), Part 6 6)
.

Fig.1. Bad weather clouds during a spring storm
.
Clouds: Unwilling slaves of CO2, or climate drivers of their own right?
According to official sources (NOAA 7), DWD 8)), the net long-term cooling effect of clouds is about -20 W/m2. It thus is much stronger than the so-called back radiation effect exerted by increased levels of “greenhouse gases,” which is assumed to be just +3,222 W/m2.
And since common sense tells us that a warming climate should result in more evaporation of water, this should in turn ultimately form more clouds – resulting in a cooling effect on earth’s climate.
.
But as we have seen in the past chapters, the IPCC and its followers stubbornly insist on pretending that CO2 and the other “non-condensing greenhouse gases” – mainly methane and N2O – are the only relevant “forcers” of climate change.
.
Water vapor and clouds – the other aggregate conditions of water in the atmosphere – are declared to be simple amplifiers who slavishly obey the directives given by the “forcers.”
The short average lifetime of water molecules in the atmosphere is forwarded as the reason why water vapor should be unable to exert a sustainable long-term influence on the evolution of the climate by itself.
This is the core of the untruth the IPCC disseminates about the reality of climate control.
.
In the previous parts of the article, we have already seen that clouds are the only climate drivers that are able to prevent solar radiation from reaching earth’s surface by reflecting noticeable proportions of it directly back into space.
No other “greenhouse gas” can produce such an effect: at best, they are just slowing down the re-emission of energy into space, after it has reached and warmed the surface.
It is really remarkable that the “official” climate science has succeeded in negating this unique feature of water in the form of clouds while attributing the role of “only climate control knob” to CO2 and its minor allies methane and N2O, see Fig 2.
.

Fig. 2. “Hockey stick” Michael E. Mann and his followers have succeeded in selling to the public the story of the red tail (CO2) that wiggles the elephant (cloud) in the room.
.
To put it clearly: in terms of climate system influence factors, CO2 is (if ever) just the tail and clouds are the elephant in the room.
Fantastic job how Michael E. Hansen and his followers have been able to sell to the public a story that literally turns reality upside down.
.
The death knell for all “tipping point” and “runaway process” allegations
.
Understanding this decisive role of clouds also implies another far-reaching recognition: clouds – as an inevitable consequence of water evaporation into the atmosphere – can and will act against and eventually stop any overheating of the planet.
.
We may therefore forget all that talk about “tipping points” and “runaway overheating” of the planet that is disseminated to raise panic among our population.
If temperature levels rise significantly, so will evaporation.
More evaporation automatically means more clouds, who are the instrument of a powerful negative feedback mechanism.
This self-readjusting control circuit has protected our planet for more than 3.5 billion years – and will continue to do so for a very, very long time to come, no matter what “hockey stick” Mann and his brethren pretend.
.
CO2 should be urgently acquitted
.
Although the basic interrelationship of water/clouds/temperature is easily understandable, the reality of climate evolution is of course way more complicated.
.
All weather and thus climate phenomena are energy-driven. The storage, transportation, dissemination and ultimately disposal of solar energy having reached the surface back into space is very complicated.
It involves short-term just as well as long-term processes that may last dozens, hundreds or several hundred thousand of years.
Just look back into Earth’s history, from the brutal swings between floods and droughts in recent decades to desertification processes, such as the one transforming a lush region in northern Africa into the Sahara, or the ice ages that repeatedly engulfed large swathes of our countries under ice sheets several kilometers thick.
We still haven’t been able to identify, let alone to understand the long-term processes that govern the evolution of our climate.
.
That is, there’s one factor that we can exclude with near certainty.
.
CO2, accused by the IPCC to be the culprit of climate change, should be acquitted, since its level in the atmosphere has been largely within a rather narrow bandwidth for several million years before present.
.
Of course, water molecules in the atmosphere will continue to have a quite short residence time.
In order to find explanations for the counter-intuitive evolution of local climates in the near past, we will have to look for other driving forces such as e.g. the El Ninjo/La Ninja temperature swings in the southern Pacific or the famous Atlantic Multidecadal Oscillation (AMO) or other, still undiscovered mechanisms.
.
IF water evaporates, it will form clouds.
But what governs its evaporation?
It seems that the temperatures determined by the currently preferred methods of meteorology do not explain why in Europe, we are experiencing a longer-term deficit with respect to clouds stemming from the evaporation of water.
.
The facts: less rain, more sun and higher temperatures in Germany
.
The complexity of climate mechanisms is highlighted by the fact that at least in large parts of northern Europe, we have a persistent lack of cloud cover and downpour for the past two decades.
This accompanied by a higher-than-normal rise in temperatures.
We have seen in part 4 of this article that in Germany, rainfall statistics show that after a slow but quite steady 120-year rise, the positive rainfall trend suddenly reversed after the year 2000, ushering in a longer-term decline, see Fig. 3.
.
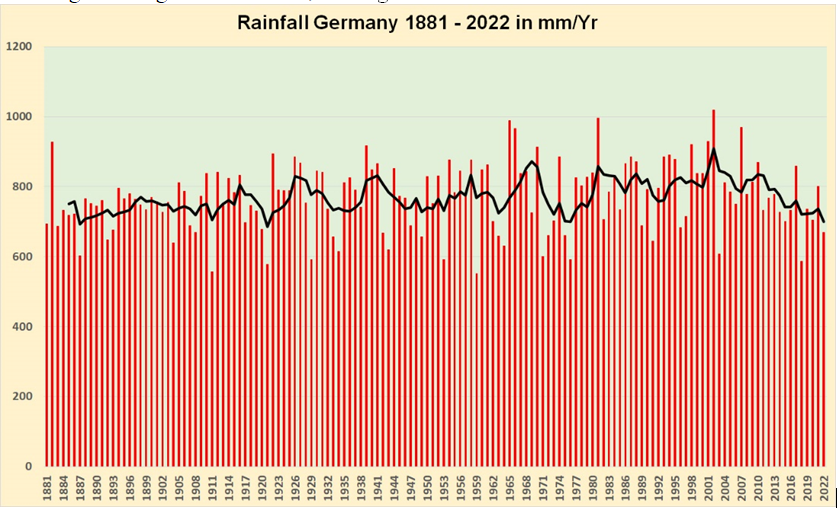
Fig. 3. Germany’s national rainfall statistic for the years 1881 – 2022 with a 5-year moving average. Graph established with data from the German Weatherservice DWD 9)
.
In search for a reason for this recessive trend in downpour over Germany, one hasn’t to go further than to the German national statistic for global solar radiation, see Fig. 4.
.
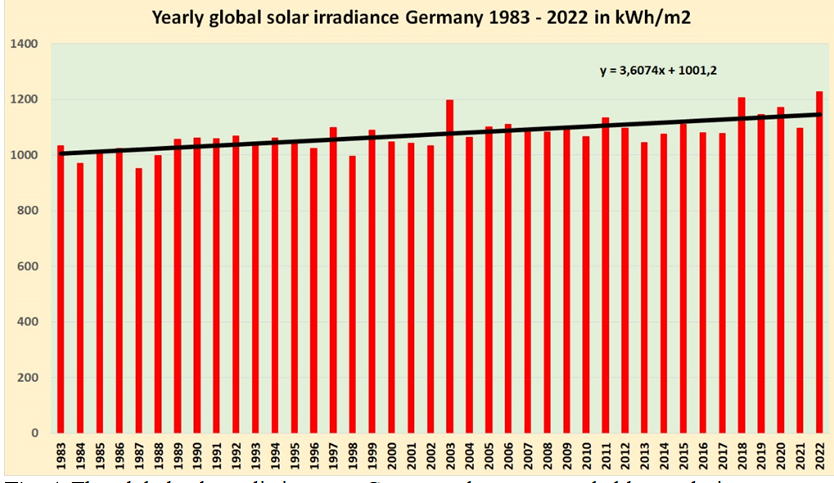
Fig. 4. The global solar radiation over Germany shows a remarkably steady increase over the past ~50 years (Graphic established using data from the DWD10))
.
The graph in Fig. 4. shows that over a time period of 50 years, the solar energy input over Germany has been steadily increasing with a decadal rate of around 3.5%.
For the past 20 years, the information of both graphs fits perfectly together: the cloud cover over the country has been steadily receding, resulting in both less rain and more solar irradiance.
.
In order to check the effect of this increase in global solar radiation input, it was only logical to include a graph showing the evolution of temperatures over Germany, Fig. 5.
.
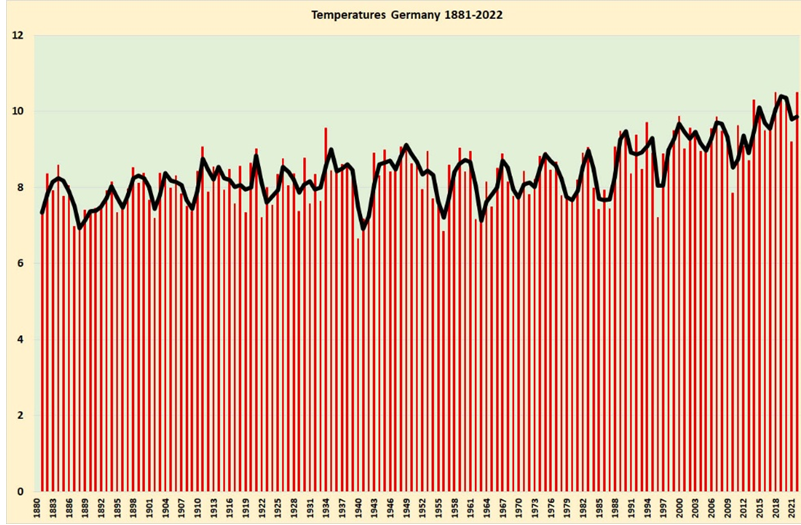
Fig. 5. Evolution of the temperatures in Germany from 1881 – 2022 with a moving 5-year average (using data provided by the BMU 11))
.
The temperature graph exhibits a slightly choppy evolution between 1881 until around 1988, followed by a marked upwards trend with a sudden boost of some 1.7°C over a time period of about 35 years.
Taking the information from these three graphs together leaves one puzzled.
.
Let’s recall that during the 63 years between 1959 and 2022, the atmospheric level of CO2 has increased from 315 to 421 ppm, an increase of some 34%.
Over the same time, temperatures in Germany have risen by some 1.7°C, a value largely exceeding even the most pessimistic forecasts of the IPCC.
The temperature levels of a Wikipedia/Berkeley earth graphic 12) for Germany extending from 1743 to 2013 show a stable temperature level of about 8°C for the years around 1750, Fig. 6.
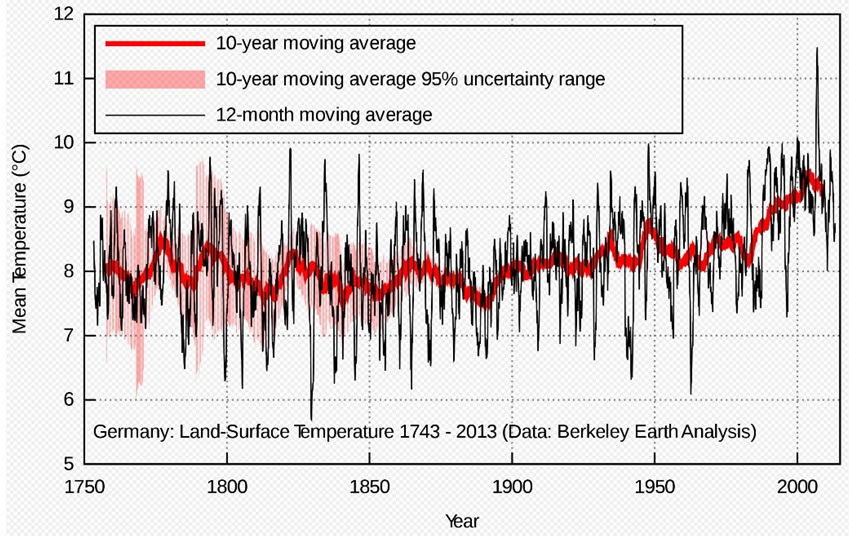
Fig. 6. Land surface temperatures in Germany from 1743 to 2013 (Graphic: Phrontis 13),CC 3.0)
.
Looking at Fig. 6 and taking into consideration the increases of the last 10 years, it seems that in Germany, not only the 1.5°C limit, but even the 2°C limit of the Paris climate deal is in acute jeopardy.
.
Be it as it will, and recalling the well-established law of atmospheric physics that a 1°C temperature increase should result in a 7% higher water content in the atmosphere 14), one can’t but wonder why Germany is currently experiencing a prolonged period of markedly reduced downpour and an equally unusual reduction in cloud cover resulting in a strong increase in global solar irradiance.
This does not really harmonize with the usual IPCC narratives.
.
And Germany is not alone
.
Now one might be tempted to think that Germany, which covers only some 3.4% of Europe’s total surface, has been experiencing an unlucky combination of chance factors.
So let’s look at Sweden, the largest of the four Nordic countries (Sweden, Norway, Finland and Denmark) who together make up some 12.5% of Europe’s surface area.
The Swedish Meteorological and Hydrological Institute (SMHI) is monitoring the yearly global solar irradiance with eight stations since 1983, see Fig. 7.
.
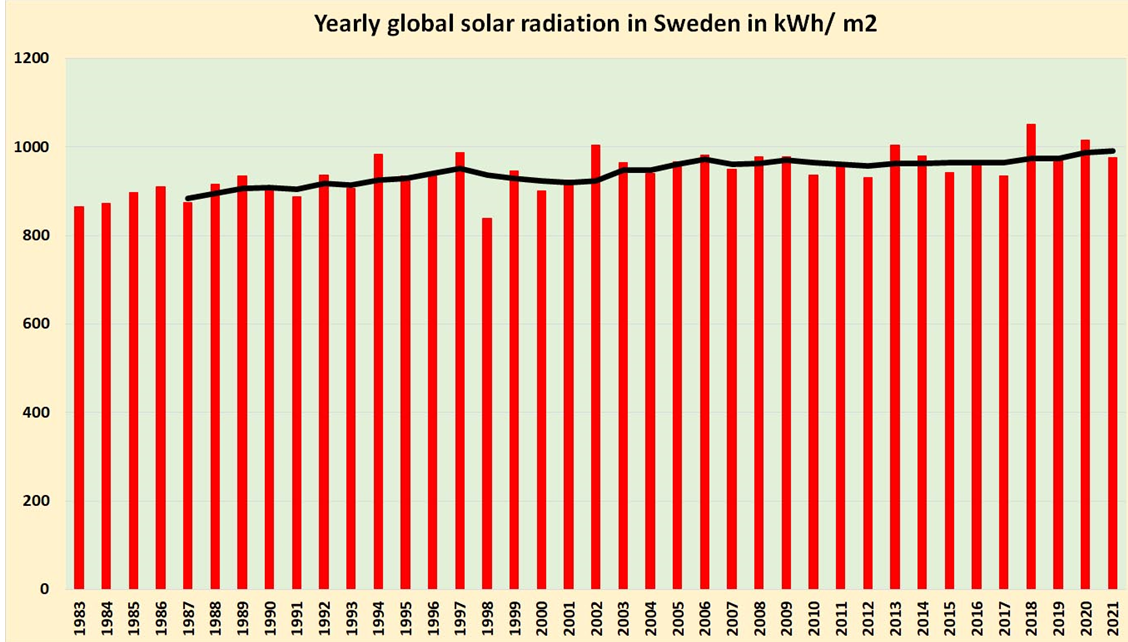
Fig. 7. The Swedish meteorologists monitor global solar radiation at eight locations since 1983. The black line shows the 5-year running average (Data: SMHI 15))
.
The global solar radiation figures provided by SMHI show a steady increase over the whole period with only one exception in the year 1998. The decadal increase is about 3% and thus corresponds well to German value.
In its explanations, the SMHI states that “The trends in global radiation cannot be explained by variations in the sun’s radiation.
The main reasons for the observed increase since the 1980s are partly a reduction in cloudiness and partly a reduction in the amount of particles in the atmosphere thanks to greatly reduced emissions of air pollution both in Sweden and the rest of Europe”.
.
The attribution related to cleaner air might be taken with some caution.
Of course, nobody will deny the Swedes their tradition as role models when it comes to pollution prevention and nature protection.
But it is nevertheless worthwhile to take note of the fact that there has been an extended period of time in the 40s, 50s and 70s when, if we dare to trust the “cleaner air explanation”, the air over the Swedish capital Stockholm seems to have been much cleaner than during the past 40 years, see Fig. 8.
.
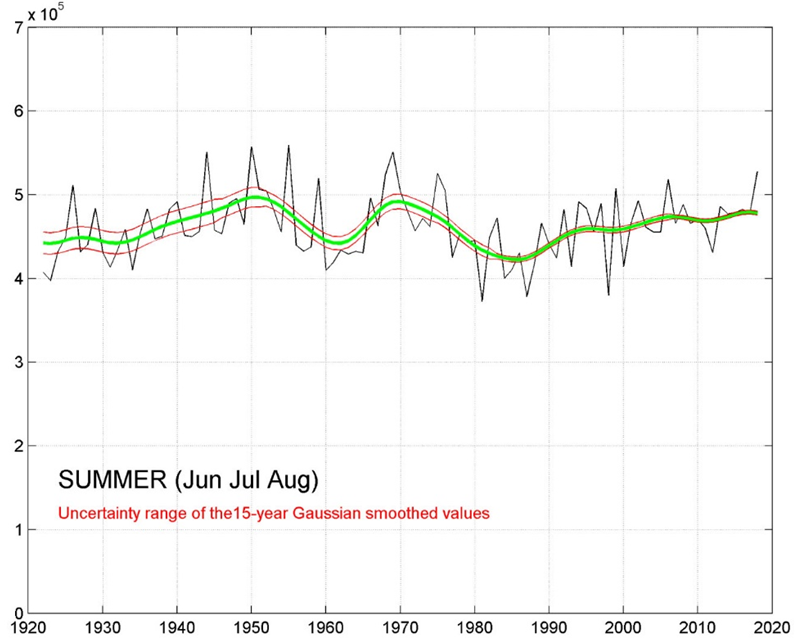
Fig. 8. This recording of global solar radiation input over Stockholm shows that it has been way higher in the fifties and seventies, at a time when vehicles and chimneys were not fitted with filters (Graphic: Weine Josefsson, SMHI 16))
.
Two interesting statements from the text presented by SMHI are that:
- “The trends in global radiation cannot be explained by variations in the sun’s radiation”.
- “A similar tendency with increasing global radiation is seen in large parts of Europe.
- Measurements taken before the 1980s indicate that solar radiation was higher in the 1960s than in the 1980s.
- The decline from the 1960s to the 1980s and the subsequent increase into the early 2000s is often referred to, in international climate research, as global dimming and brightening”.
.
As the time before the 80s largely coincides with the worst periods of unfiltered industrial and household pollution throughout Europe, “dimming and brightening” variations such as those documented in Fig. 7. may be rather attributed to variations in cloudiness than to aerosols.
It would really be hard to maintain that the pollutant density in the 50ies and 70ies would have been much lower than in the 21st century.
.
Other European countries
The climatic peculiarities we have seen here are not limited to Germany and the northern European countries alone.
A research project performed in the Netherlands during a record heatwave in 2020 17)looked into global solar irradiance records maintained since 1928 and found that of the ten years with the highest values, eight had been in the 21st century, see Fig. 9.
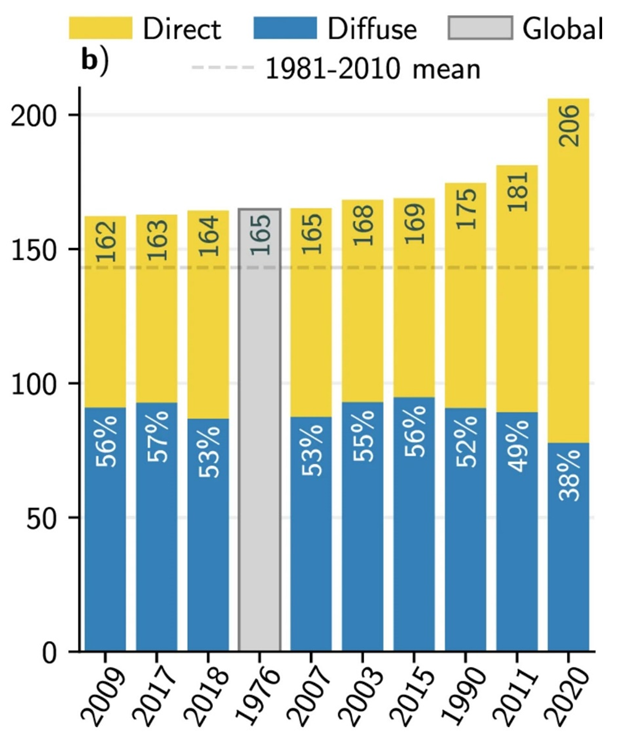
Fig. 9. Research conducted in the Netherlands showed that eight of the ten years with the highest solar irradiance were grouped in the 21st century (Graphic: van Heerwarden, C., et al. 17))
.
The detailed analysis of the different fractions of global solar radiation (direct and diffuse) revealed that only 1.3% (2.3 W/m2) increase relative to the 2010-2019 mean were attributable to a low median aerosol optical depth while 17.6% (30.7 W/m2) were the result of several exceptionally dry days and a very low cloud fraction overall.
.
The authors concluded that “the reduced aerosols and contrails due to the COVID-19 measures (remark: a topic that was hotly discussed at the time) are far less important in the irradiance record than the dry and particularly cloud-free weather”.
.
This insight might also apply to other research work such as the projects undertaken in Sweden.
.
Further, countries exhibiting comparable weather patterns as those described for Germany and the Scandinavian countries are Switzerland 18) where downpour has declined during the past two decades and France 19) from where we have recently been hearing news that farmers are organising prayers for rain 20).
.
How did the US fare in contrast?
.
In the United States, an extensive study performed by Long, C.N. et al. 21) looked into the phenomenon of dimming and brightening of the sky over the US Territory.
They report, during a period extending from roughly the 1960s through the late 1980s or early 1990s, a multi-decadal decrease of down-welling solar radiation (global dimming) had been recorded.
Based upon data collected over 12 years from 1995 to 2007 from several stations operated by ARM resp. NOAA, they found, this trend had been reversed to a decadal brightening averaging about 8 W/m2 for the all-sky down-welling solar radiation.
They conclude, “the causes of this brightening cannot be solely attributed to changes in dry aerosols or aerosol direct effects, but at least in the all-sky case likely include a cloudiness component contributing to the changes.”
.
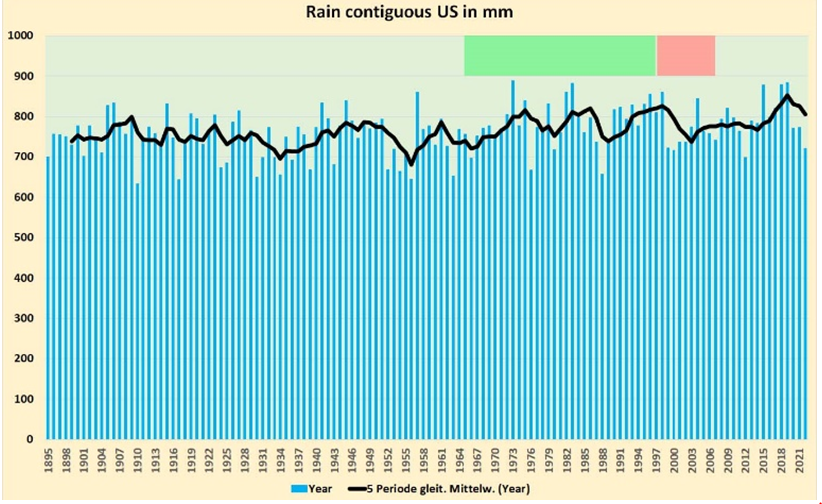
Fig. 10. Timeline of rain for the US from 1895 to 2022 with a 5-year running average (black line). The data for the graph were combined from a discontinued NASA publication 22) containing absolute figures and an EPA publication 23) with anomalies
.
Unfortunately, these findings do not offer convincing clues as to any underlying interrelationships.
A look at the downpour data for the contiguous US shows that the time periods mentioned do coincide with a slow rise in rainfall for the first period (upper green horizontal bar) and a clear recessive downpour tendency for the second period (upper red horizontal bar).
The best conclusion one can draw when comparing the climate evolution in the US and Europe is that the long-term patterns do not exhibit convincing similarities.
.
A blow to mainstream climate science
.
The situation in Europe poses a real challenge to the IPCC climate theory, because it doesn’t fit into the usual narrative of more atmospheric CO2 leading to higher temperatures which in turn result in more rain.
The facts of the past 20 years document a completely different pattern, with the higher temperatures clearly attributable to a reduction in cloud cover.
This is equivalent to a complete breakdown of the narrative that CO2 and the other non-condensing “greenhouse gases” are the only “control knob” for adjusting our climate, with water vapor and clouds seen as simple “slaves” having to amplify the directives dictated by their masters, and that on short notice.
.
But there are of course climate scientists that have taken note of this threat to their breadwinning occupation and toil on suited supplements.
.
In a related research paper24) titled “Global warming without global mean precipitation increase?”, the author starts by conceding that “Global climate models simulate a robust increase of global mean precipitation of about 1.5 to 2% per kelvin surface warming in response to greenhouse gas (GHG) forcing”.
His explanation is, “when GHG and aerosol forcings are combined, the climate models with a realistic 20th century warming (which ones?), indicate, the global mean precipitation increase, due to GHG warming has, until recently, been completely masked by aerosol drying.
This explains the apparent lack of sensitivity of the global mean precipitation to the net global warming recently found in observations.
As the importance of GHG warming increases in the future, a clear signal will emerge”.
.
The problem is too little evaporation and clouds, not too much CO2
.
Instead of stubbornly clinging to “climate models with a realistic 20th century warming”, it would be preferable to stick to well-documented facts.
The researchers in Sweden, the Netherlands and the US have found no clues of a dominant influence of aerosols on global solar irradiance.
On the contrary, at least the European researchers imply a lack of cloud cover as source of the increased amount of solar energy reaching the ground.
This leads to temperature increases of up to 2°C within some 35-40 years.
Compare this with the IPCC claim that we should wipe out our technical civilization (based on fossil fuels), in order to prevent earth’s temperature from exceeding a 1.5°C rise limit.
.
With the start date set at 1750, this amounts to a permissible average temperature rise rate of 0.0055°C/ year. .
Looking at Germany, we see that its current average temperature rise rate has reached 0,031°C/year, a figure that is nearly sixfold higher than the threshold set by the IPCC.
.
Several other European countries are subjected to a comparable temperature evolution.
So what about the claim that “Global climate models simulate a robust increase of global mean precipitation 24) of about 1.5 to 2% per kelvin surface warming in response to greenhouse gas (GHG) forcing” (on a side note, this is not really fully in line with the 7% claimed by source 14)).
Is there a convincing explanation for this long-term deviation from the IPCC’s CO2-based global warming theory.
.
The obvious main lever for this development is not an increase in CO2, but rather an unexplained lack of water vapor in the atmosphere, resulting in less cloud cover and less rain.
In view of these facts, one has to ask whether the laws governing the evaporation of water don’t apply any more, or if the global temperature measurements aren’t trustworthy, or what other mechanisms might be involved.
.
In the next sections, we will try to look further into these questions.
To be continued – stay tuned.
.
Sources:
1) https://notrickszone.com/2023/01/14/a-diy-guide-to-demystifying-gre...
2) https://notrickszone.com/2023/01/18/climate-scientists-using-grossl...
3) https://notrickszone.com/2023/01/27/measurements-show-cloud-effects...
4) https://notrickszone.com/2023/02/21/objective-science-assessment-hy...
5) https://notrickszone.com/2023/03/19/rainfall-cyclone-data-show-no-c...
6) https://notrickszone.com/2023/03/31/water-vapor-clouds-are-the-real...
7) https://www.gfdl.noaa.gov/cloud-radiative-effect/
8) https://www.dwd.de/EN/research/observing_atmosphere/lindenberg_colu...
9) https://www.dwd.de/DE/leistungen/zeitreihen/zeitreihen.html#buehneTop
10) https://www.dwd.de/DE/leistungen/solarenergie/Trend_seit1983.html?n...
11) https://www.umweltbundesamt.de/daten/klima/trends-der-lufttemperatu...
12) https://de.wikipedia.org/wiki/Zeitreihe_der_Lufttemperatur_in_Deuts...
13) File:Germany-TAVG-Trend 1743-2013.svg – Wikimedia Commons
14) https://www.e-education.psu.edu/earth103/node/558
15) https://www.smhi.se/en/climate/climate-indicators/climate-indicator...
16) https://www.smhi.se/publikationer/publikationer/long-term-global-ra...
17) https://www.nature.com/articles/s43247-021-00110-0
18) https://www.meteoschweiz.admin.ch/service-und-publikationen/applika...
19) https://tradingeconomics.com/france/precipitation
20) https://orf.at/stories/3308706/
21) https://agupubs.onlinelibrary.wiley.com/doi/full/10.1029/2008JD011263
22) http://data.giss.nasa.gov/precip_cru/graphs/
23) https://www.epa.gov/climate-indicators/climate-change-indicators-us...
You need to be a member of Citizens' Task Force on Wind Power - Maine to add comments!
Join Citizens' Task Force on Wind Power - Maine