VERMONT “STANDARD OFFER” RENEWABLE ENERGY PROGRAM IS TOO EXPENSIVE
The original SPEED program, started in July 2010, was repealed and replaced by Act 56 of 2015, the Renewable Portfolio Standard, RPS, act, which requires 55% of utility retail electricity sales to be from renewable sources by 2017; 75% by 2032. The SPEED program replacement is called Standard Offer, SO, as described in 30 VSA 8005b.
SO projects, 2.2 MW or less:
Those projects have a cap of 127.5 MW by 2022; about 60,850 kW, all energy sources, has been installed which produced about 128,754 MWh during the latest 12 months; the 48,867 kW of PV solar produced about 62,318 MWh. The 2022 production of all SO projects would be about 269780/6100000 = 4.5% of electricity supply to utilities. See table 1.
In 2022, the 48867, installed end 2017 + 53525, to be installed = 102,392 kW of PV solar would produce 130,576 MWh, requiring a capital investment of about 102,392 x $4000/kW, 22-y average = $410 million during the 2010 - 2022 period.
In 2022, the 11983, installed end 2017 + 13125, to be installed = 25,108 kW of Other category would produce 139,204 MWh, requiring a capital investment of about 25,108 x $2500/kW, 22-y average = $63 million during the 2010 - 2022 period.
http://www.vermontstandardoffer.com/standard-offer-program-summary/
PV Solar Subsidy Cost Estimate for 2010 - 2017 Period: About 48,867 kW of PV solar projects was installed since 2010. The 7-y total subsidy cost (2010 - 2017) was at least (48,867 kW/2000 kW) x $3.5 million = $85.5 million, just for the PV solar projects; earlier feed-in tariffs were much higher than at present. See table 4.
http://puc.vermont.gov/document/7874-standard-offer-solar-cash-flow...
SO projects greater than 2.2 MW:
Those projects have no MW cap.
Table 1/SO 2.2 MW or less |
Capacity |
Production 2017 |
2018 - 2022 |
Production 2022 |
kW |
MWh |
kW |
MWh |
|
Cap |
127500 |
|||
Installed |
To be installed |
|||
All sources |
60850 |
128754 |
66650 |
269780 |
PV solar |
48867 |
62318 |
53525 |
130576 |
Other |
11983 |
66436 |
13125 |
139204 |
Under Act 56, utilities would be required to own RE projects and/or have power purchase agreements, PPAs, with the owners of in-state and out-of-state electricity producers. Utilities earn up to 9%/y on their asset base, as determined by Public Utilities Commission, PUC.
Under Act 56, the electricity prices at which owners of SO projects would be compensated are as shown in table 1A, i.e., about 2 - 3 times higher than NE annual average wholesale prices. Having a lot of such expensive electricity become part of the contracted electricity mix would increase electric rates.
Excessive Costs of SO Program: It has become abundantly clear the electricity cost of the SO program is becoming grossly excessive, based on information from Vermont Department of Public Service, DPS, website. Continuing the program on its present course, as if all is well, would be irresponsible.
The main purpose of this article is to describe:
- A history of the increasing electricity cost, c/kWh, for projects 2.2 MW or less, largely due to the high feed-in tariffs for PV solar of up to 30 c/kWh, as determined by the PUC.
- The cost-reducing effect on electricity cost, c/kWh, due to competitive auctioning of PV solar projects.
Comparison of Renewable Portfolio Standards in Various States: Renewable portfolio standards require utilities to have a percentage of their electricity supply (or retail sales) from renewable sources. Two states, Hawaii and Vermont, require much higher percentages of renewable energy than any other state in the nation. See table 1.
Hawaii is much closer to the equator, has steady trade winds and much sunshine, and has the highest electric rates in the United States. The Hawaii goal is reasonable.
The Vermont goal, with poor sunshine and average winds, is unreasonable, as it will result in excessive energy costs/kWh and reduced economic growth. See URLs and Table 3.
Table 1; State RPS Goals
State |
Goal |
Year |
Goal |
Year |
Goal |
Year |
Goal |
Year |
|
% |
|
% |
|
% |
|
% |
|
CT |
27.0 |
2020 |
|
|
|
|
|
|
RI |
14.5 |
2019 |
38.5 |
2035 |
|
|
|
|
ME* |
40.0 |
2017 |
|
|
|
|
|
|
NH |
24.8 |
2025 |
|
|
|
|
|
|
MA* |
15.0 |
2020 |
|
|
|
|
|
|
VT |
55.0 |
2017 |
75 |
2032 |
|
|
|
|
HI |
30.0 |
2020 |
40 |
2030 |
70 |
2040 |
100 |
2045 |
* MA percent to increase by 1%/y after 2020; the ME and VT goals are higher, because they include hydro as a renewable source.
Feed-in Tariffs of SO Projects, 2.2 MW or less: The SO program covers various energy sources for electricity production. The feed-in tariffs, set by the PUC, are shown in table 1A. The feed-in rates are about 2.5 times the NE annual average wholesale prices.
The “Wind 100 kW or less” feed-in rate was set high to favor/subsidize Northern Power Systems, Barre, Vermont, which markets 100 kW wind turbines. The PV solar feed-in tariff was recently reduced from 25.7 c/kWh to 13.0 c/kWh. See table 2. See URL and click on Avoided Cost Caps.
http://www.vermontstandardoffer.com/2017-avoided-costs/
http://www.northernpower.com/wind-power/nps100/
Table 1A |
c/kWh |
Period |
PV Solar |
13.0 |
Fixed for 25y |
Hydro |
13.0 |
Fixed for 20y |
Landfill gas |
9.0 |
Fixed for 15y |
Farm methane |
20.8 |
Fixed for 20y |
Wind over 100 kW |
11.6 |
Fixed for 20y |
Wind 100 kW or less* |
25.8 |
Fixed for 20y |
Biomass |
12.5 |
Levelized over 20y |
Decreasing Federal Subsidies: Federal subsidies for wind, solar, and other renewable sources will be decreasing in future years. Table 2 shows:
- Investment Tax Credit, ITC, and Production Tax Credit, PTC. Vermont has a solar ITC, which is about 15.6% of the federal ITC, per the PUC cash flow model. See below URL.
- A decreasing wind ITC and wind PTC.
Investors in wind turbines on Vermont’s ridgelines have a choice of either the 30% upfront ITC or the PTC for the first 10 years of project operation, plus the tax savings due to rapid asset depreciation. Owners use the tax credits to offset federal and state taxes on any other business.
The “accelerated depreciation" subsidy (within 6 years) remains for commercial owners after ITCs have expired. It reduces the income taxes of multi-millionaire investors.
No wonder pro-RE interests are crowing about wind and solar being so competitive with traditional electricity sources, such as coal, gas, nuclear and hydro. With enough subsidies and hiding/fuzzing various costs, anything can be made to look successful.
https://www.novoco.com/sites/default/files/atoms/files/path_act_sum...
http://www.seia.org/research-resources/impacts-solar-investment-tax...
Table 2 |
Wind ITC |
Wind PTC |
Solar ITC Res’l |
Solar ITC Com’l |
|
% |
c/kWh |
% |
% |
2015/2016 |
30 |
2.3 |
30 |
30 |
2017 |
24 |
1.8 |
30 |
30 |
2018 |
18 |
1.4 |
30 |
30 |
2019 |
12 |
0.9 |
30 |
30 |
2020 |
Expired |
Expired |
26 |
26 |
2021 |
|
|
22 |
22 |
2022, etc. |
|
|
Expired |
10 |
Wind and Solar a Boon to Multi-millionaires: Warren Buffett, considered one of the outstanding investors of all-time, has stated: “On wind energy, we get a tax credit if we build a lot of wind farms. That’s the only reason to build them. They don’t make sense without the tax credit”. Buffett has investments in multiple wind sites, as do many other multi-billion dollar entities. Buffett and his cohorts hire tax accountants/lawyers to refine the subsidy-milking art form, as well as PR pros and RE lobbyists to continually increase the milking, via higher RPS targets and renewed subsidy periods.
Example of “Standard Offer” Subsidies of PV Solar Systems: In Vermont, a PV solar system, 2000 kW, turnkey capital cost about $5.9 million, produces about 2794 MWh/y and has revenues of about $365,000/y.
Table 3/Funding Source |
$ |
%/y |
Short term loan |
1,356,212 |
4.0 |
Long term loan |
1,356,212 |
3.0 |
Fed and state ITCs |
1,376,189 |
Upfront gift |
Owner |
1,808,283 |
|
Total |
5,896,897 |
|
During the first 6 years, the equivalent of about 3.5/5.9 = 59% of the turnkey capital cost consists of:
1) Upfront federal and state ITCs
2) Taxes not paid due to rapid asset depreciation, about 5 years
3) Excess costs over NE wholesale prices. See URL and table 4
The heavily subsidized electricity is sold at 13.036 c/kWh, but higher-quality electricity (not variable, not intermittent, steady, 24/7/365) could have been bought by utilities at the NE annual average midday wholesale price of about 6 c/kWh.
If the ITCs were removed, and the write-off period were a more normal 15 years, the electricity would need to be sold for at least 20c/kWh, more than 3 times NE midday wholesale prices.
- The variable, intermittent solar electricity is bought by utilities from owners at 13.036 c/kWh. Higher-quality electricity (not variable, not intermittent, steady, 24/7/365) could have been bought by utilities at the NE annual average midday wholesale price of about 6 c/kWh. The excess electricity costs will occur for 25 years, per SO contract. Clearly, the overall cost of SO PV solar is much greater than the 13.036 c/kWh paid to owners. See table 3.
- The federal ITC is 30% of the qualified portion of the turnkey capital cost. The qualified portion is 1,190,475/0.30 = $3,968,250 of the $5.9 million turnkey capital cost, or 67%.
- The state ITC is 185,714/1,190,475, or 15.6% of the federal ITC.
- Owners collect ITCs up front and avoid paying any taxes due to rapid asset depreciation, for a total of $2,332,758, during the first 6 years. See table 3.
If the 6-y subsidy costs ($3,497.810) were divided by the 6-y electricity production (16,558 MWh), the subsidy cost would be 21.2 c/kWh during these 6 years, on top of the 13.036 c/kWh paid to owners.
Whereas owners pay no taxes for the first 6 years, after year 6, the project would have taxable income on which state taxes ($285,476) and federal taxes ($1,075,571) likely would be collected during the 7 - 25 year period.
Owners are not required to pay Vermont sales taxes on items used for construction of the project, and the education portion of real estate taxes. The subsidy train seems to be never-ending. Other households and businesses have to pay these taxes.
For comparison, the steadily increasing real estate/school taxes of a typical homeowner would be about $250,000 over 25 years.
Table 4/Year |
1 |
2 |
3 |
4 |
5 |
6 |
6-y total |
State tax not paid |
42996 |
78104 |
41169 |
18803 |
18337 |
1227 |
200636 |
Fed tax not paid |
161996 |
294270 |
155112 |
70845 |
69087 |
4623 |
755933 |
Total tax not paid |
204992 |
372374 |
196281 |
89648 |
87424 |
5850 |
956569 |
State ITC gift |
185714 |
185714 |
|||||
Fed ITC gift |
1190475 |
1190475 |
|||||
Total ITC gift |
1376189 |
1376189 |
|||||
Total tax subsidies |
1581181 |
372374 |
196281 |
89648 |
87424 |
5850 |
2332758 |
Paid to owners for electricity |
2158559 |
||||||
Wholesale cost at 6 c/kWh |
993507 |
||||||
Total energy subsidy |
1165052 |
||||||
Total subsidy |
3497810 |
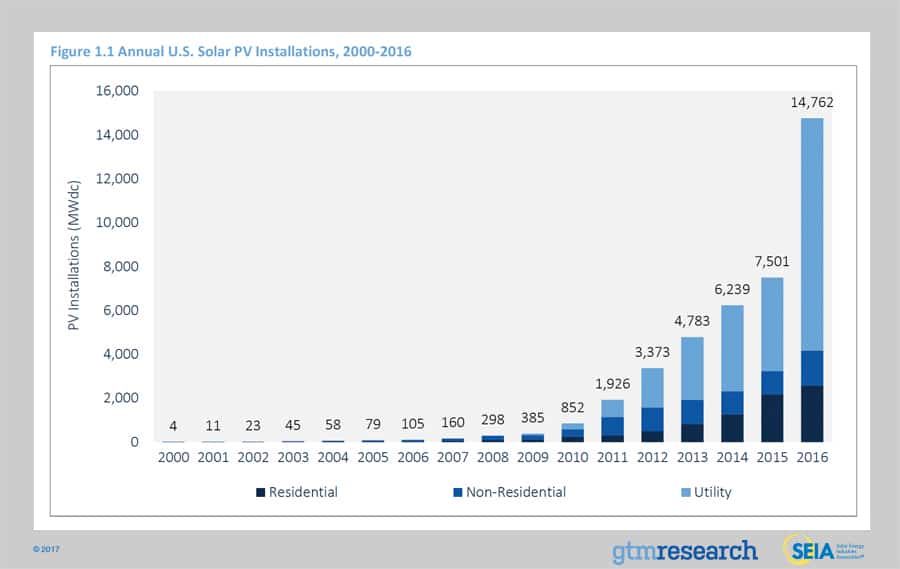
Estimate of US Total Annual PV Solar Subsidies: At end 2016, the US had installed 40,300 MW of PV solar; 14,700 MW was added in 2016. See URL.
https://en.wikipedia.org/wiki/Solar_power_by_country
https://www.greentechmedia.com/articles/read/us-solar-market-grows-...
https://www.seia.org/sites/default/files/1-1-AnnualUSPVInstallation...
Estimate of US PV Solar Subsidies: In 2016, about 10,700 MW of PV solar was added by utilities and private entities having PPAs with utilities. Those owners benefitted from the ITCs, the rapid asset depreciation tax savings, and the generous feed-in tariffs, as mandated by Washington, Oregon, California, Vermont and Maine. See URL.
https://www.eia.gov/todayinenergy/detail.php?id=11471
The cost of those three financial benefits would be about 10,700 MW/2 MW x $2.5 million* = $13.4 billion for the first 6 years.
* I assumed those benefits would be $2.5 million per 2 MW, on a US basis. In Vermont, a high-cost state for PV solar, the financial benefits total about $3.5 million for a 2 MW system. See table 3.
If in 2017, and in each subsequent year, the US would add 10,700 MW of PV solar owned by utilities and private entities having PPAs with utilities, the build-outs of each of these years would have their own financial benefits lasting 6 years. The steady state condition would be a continuous, 6-yr stack of at least 6 x 10,700 = 64,200 MW of PV solar with benefits, about $13.4 billion/y on a continuous basis; as one cohort drops of, another is added.
- In 2016, about 2,500 MW of PV solar of distributed residential PV was added, which qualified for ITCs and generous feed-in tariffs.
- In 2016, about 1,500 MW of PV solar of non-residential PV was added, which qualified for ITCs, rapid depreciation tax savings and generous feed-in tariffs. Their financial benefits were not estimated in this article.
Production of SO Projects, 2.2 MW or less, 2010 - 2017: The production of projects, 2.2 MW or less (all energy sources), were obtained from the below URLs. The “Excess payment” is based on an annual average wholesale price of 6.0 c/kWh that utilities could have paid for that electricity. Electricity supply to utilities is based on 6,000,000 MWh/y. See table 5.
- The “Excess payment” was $11,565,987 for only the PV solar projects, See table 5.
- The “Excess payment” was at least $20 million for all projects. See table 4.
- Supply by all SO projects to VT utilities became 2.15%, after about 7 years; PV solar 1.04%. See table 6.
Those excess payments significantly increased as more PV solar projects, with 25.7 c/kWh feed-in tariffs, were added to the project mix (recently reduced to 13.0 c/kWh). See Table 5.
Excess payments started small, then ballooned into something big, as was predicted in 2010. That prediction was ignored/derided, because pro-RE interests, aided and abetted by some leading pro-RE legislators, wanted to rake in as much federal subsidies, as quickly as possible, under the banner of saving the world, fighting global warming, etc.
Despite effusive claims of the benefits of the SO program in the reports/studies by friendly “consultants”, hired by pro-RE interests, the real effect has been to send money to the tax shelters of in-state and out-of-state multi-millionaires, taken, directly or indirectly, from the pockets of already-struggling households and businesses trying to make ends meet in an anemic, near-zero, real-growth Vermont economy.
The SO program, whereas creating a few jobs (due to subsidies), has infused expensive energy into the Vermont economy, which has resulted in just another government-inspired headwind against economic growth. See table 5.
Vermont SPEED monthly production
Table 5 |
Production |
Paid to owners |
Price |
Excess payment |
Utility supply |
|
kWh |
$ |
c/kWh |
$ |
% |
2010 |
5,980,779 |
829,832 |
13.87 |
470,687 |
0.10 |
2011 |
20,172,973 |
3,329,269 |
16.44 |
2,106,058 |
0.34 |
2012 |
29,666,592 |
5,093,237 |
17.16 |
3,310,792 |
0.49 |
2013 |
44,822,813 |
8,692,749 |
19.19 |
5,912,129 |
0.75 |
2014 |
62,865,075 |
13,190,928 |
20.98 |
9,417,188 |
1.05 |
2015 est |
|
|
|
13,000,000 |
|
2016 est |
|
|
|
16,500,000 |
|
2017 est |
128,748,000 |
|
|
20,000,000 |
2.15 |
Here are some comments on table 4:
The “Paid to owners” column shows the amount paid mostly to the risk-free tax shelters of in-state and out-of-state multi-millionaires, who own the larger PV solar systems.
- The owners received from the federal and state government (that is us) the equivalent of about $3.5 million/$5.9 million = 59% of the turnkey capital cost as tax and energy subsidies.
- The owners can depreciate most of the turnkey capital cost over 6 years, which avoids federal and state income taxes.
- The renewable energy credits, RECs, are often sold to out of state entities, so Vermont cannot even claim that energy towards its RE goals. Since 2010, a huge amount on money was paid to owners with no benefit to Vermonters and state RE goals.
No wonder groups of multi-millionaires in various states are lining up to get in on such a good deal to tax shelter their high taxable incomes. What multi-millionaires pay less in taxes, others, i.e., mostly the already-struggling Vermont middle class, have to make up. Out-of-state multi-millionaires are turning Vermont into an electricity-producing colony to fatten their tax shelters. During photo-ops, pro-RE interests and politicians are pointing to the big wind and solar visuals to promote their “global warming fight” and collect “campaign contributions”.
The “Excess payments” exists, because of the excessive PV solar feed-in tariff. To provide political cover, the PUC hired friendly energy consultants who came up with a convoluted “avoided cost-based prices,” method, whatever that means. The method of calculating those “avoided cost-based prices” seemed far-fetched to me, and others, including at least one Vermont utility CEO.
NOTE: A few years ago, Hallquist, CEO of Vermont Electric Cooperative, testified to the Legislature, the Vermont production cost of field-mounted PV solar systems is about 17 c/kWh for systems 1,000 kW and larger, based on his calculations.
After the Hallquist testimony, the PUC continued to ordain compensation to subsequent PV solar project owners at 25.7 c/kWh. Also, after the Hallquist testimony, PV solar panel prices further decreased, largely due to imports of PV solar panels.
As it became politically embarrassing to maintain the 25.7 c/kWh, the PUC finally admitted something had to be done about the grossly excessive “Excess payment” costs. Accordingly, the PUC:
- Lowered the PV solar feed-in rate to 13.0 c/kWh, a 50% reduction from the grossly excessive 25.7 c/kWh.
- Rescinded/abandoned its “avoided cost-based prices” method, in favor of issuing requests for proposal, RFPs, to auction off (i.e., competitive bidding, the American way) a pre-determined MW of PV solar projects for a year. The lowest qualified bidders would get to build the projects.
This sensible, cost-saving approach had been practiced in Germany for some years, i.e., Vermont had not been a leader. Thus far this has led to 4 PV solar projects compensated at about 50% less per kWh. The excess payments were rolled into the electric rates of already struggling Vermont households and businesses*.
* Those households and businesses are trying to make ends meet, many of them with declining or stagnant real household incomes since about 2000; in an anemic, near-zero, real-growth Vermont economy; with a cost of living index of 120 versus the U.S. average of 100; with a bloated government and expensive quasi-government sector (Efficiency Vermont, etc.) growing at a greater rate than the increasingly hollowed-out private sector; with the fourth highest electric rates in the U.S., right after Hawaii, Alaska and Connecticut, partially due to having to subsidize and finance expensive, ineffective, inefficient, job-destroying, wind and solar SO programs that produce variable, intermittent, i.e., grid-disturbing, energy at 2.5 - 5 times NE wholesale prices.
NOTE: New England electricity prices, as purchased by utilities on the NE wholesale market:
- Annual average about 5 c/kWh since 2009
- At late night/early morning about 3 cents
- At midday, solar electricity at high levels, about 6 cents
- At late afternoon/early evening, peak hours, wind and solar electricity usually minimal, about 7 to 8 cents.
NOTE: New England wholesale prices have averaged about 5 c/kWh for steady, 24/7/365 electricity since about 2008, primarily due to:
- Natural gas electricity; 50% of NE generation; low-cost (5 c/kWh), low-CO2 emitting, clean (no particulates), domestic fuel.
- Nuclear electricity; 26% of NE generation; low-cost (5 c/kWh), low-CO2 emitting, clean (no particulates), domestic fuel.
Just imagine the adverse impact on NE electric rates, if all that electricity were generated by:
1) 500-ft.-tall wind turbines on pristine ridgelines at about 9.5 c/kWh (heavily subsidized); plus
2) Offshore wind turbines at about 20-plus c/kWh (heavily subsidized); plus
3) Tens of thousands of acres of PV panels on open meadow lands (heavily subsidized); plus
4) At least $10 billion for grid investments to connect wind turbines and PV panels; plus
5) The cost of the other generators having to operate less efficiently (more fuel/kWh, more CO2/kWh, more wear and tear/kWh) to provide the required peaking, filling-in, and balancing, 24/7/365, whenever the variable, intermittent wind and solar electricity would be insufficient to satisfy demand.
Items 4 and 5 usually are charged to ratepayers or taxpayers, as are the subsidies of items 1, 2, and 3. See URLs.
http://www.windtaskforce.org/profiles/blogs/a-very-expensive-offsho...
http://www.windtaskforce.org/profiles/blogs/fuel-and-co2-reductions...
NOTE: Foreign PV solar panel companies have been dumping PV cells and PV panels in the US market; imports, led by China, increased 5 times and about 30 US-based companies stopped manufacturing since 2012. After years of damage to US manufacturers, the US international Trade Commission may impose an import tariff of 40 c/W for cells, and 78 c/W for panels.
High Job Growth in RE Sector, Low Job Growth Elsewhere: Vermont RE proponents boast about job creation in the RE sector, but they do not mention that is largely due to excessive RE subsidies. A VT-DPS study, performed under Governor Douglas, showed subsidized job creation in the RE sector likely caused elsewhere in the economy:
- About an equal elimination of non-RE jobs
- An increase of non-RE jobs with reduced hours
- Smaller wage increases in non-RE jobs
The study was removed from the DPS website, because it likely “did not fit” the established pro-RE mantras! Here is the old URL, which is no longer accessible.
http://publicservice.vermont.gov/planning/DPS%20White%20Paper%20Fee...
SO PV Solar Projects as of August 2017: Below is a table of in-operation PV solar projects, as listed on the DPS website. Owners of the projects are paid an average of about 24.56 c/kWh. See table 6.
The production was about 62,318 MWh/y during the latest 12 months. The electricity supply to utilities is about 6,000,000 MWh/y, i.e., PV solar grew to about 1.04% of the supply to utilities since 2010.
The “Excess payment” is about $11,565,987 for just the PV Solar projects, based on the NE annual average midday wholesale price of 6.0 c/kWh.
The 24.56 c/kWh is about 3 - 4 times NE annual average midday wholesale prices. Clearly the excess payments were rapidly increasing from year to year, as more SO projects were built. See table 6.
Table 6 |
Type |
Production |
Capacity |
Price |
Paid to owner |
|
|
MWh/y |
kW |
c/kWh |
$/y |
Advanced Transit |
Solar |
41 |
32 |
30.00 |
12,300 |
Barton Solar Farm |
Solar |
2,401 |
1890 |
27.10 |
650,671 |
Bobbin Mill |
Solar |
64 |
50 |
24.00 |
15,360 |
Bridport West Solar Farm |
Solar |
2,540 |
2000 |
27.10 |
688,340 |
Butternut Farm Solar |
Solar |
131 |
103 |
24.00 |
31,440 |
Champlain Valley Solar Farm |
Solar |
2,794 |
2000 |
14.41 |
402,615 |
Charlotte Solar |
Solar |
2,540 |
2000 |
24.00 |
609,600 |
Chester Solar |
Solar |
2,540 |
2000 |
24.00 |
609,600 |
Claire Solar |
Solar |
2,794 |
2200 |
27.10 |
757,174 |
Clarendon Solar |
Solar |
2,540 |
2000 |
24.00 |
609,600 |
Clarke Solar Center, LLC |
Solar |
1,016 |
800 |
27.10 |
275,336 |
Coventry Solar |
Solar |
2,794 |
2200 |
27.10 |
757,174 |
Cross Pollination One |
Solar |
2,540 |
2000 |
30.00 |
762,000 |
Ferrisburgh Solar Farm |
Solar |
1,330 |
1047 |
30.00 |
399,000 |
IRA Rentals Solar |
Solar |
47 |
37 |
27.10 |
12,737 |
Kingsbury Solar |
Solar |
61 |
48 |
24.00 |
14,640 |
Leunig's Building |
Solar |
33 |
26 |
30.00 |
9,900 |
Limerick Solar |
Solar |
2,751 |
2166 |
27.10 |
745,521 |
Northshire |
Solar |
20 |
16 |
24.00 |
4,800 |
Otter Valley Solar |
Solar |
2,769 |
2180 |
13.38 |
370,492 |
Pownal Park Solar |
Solar |
2,794 |
2200 |
10.96 |
306,222 |
Sheldon Springs Solar |
Solar |
2,794 |
2200 |
24.00 |
670,560 |
South Burlington Solar |
Solar |
2,802 |
2206 |
30.00 |
840,600 |
Southern VT Energy Park |
Solar |
2,540 |
2000 |
30.00 |
762,000 |
Springfield Solar Alliance |
Solar |
1,270 |
1000 |
27.10 |
344,170 |
St. Albans Solar Farm |
Solar |
2,540 |
2000 |
24.00 |
609,600 |
Sudbury Solar |
Solar |
2,540 |
2000 |
14.40 |
365,760 |
SunGen1 Solar |
Solar |
2,667 |
2100 |
30.00 |
800,100 |
Technology Drive Solar |
Solar |
2,540 |
2000 |
27.10 |
688,340 |
Whitcomb Farm |
Solar |
2,794 |
2200 |
27.10 |
757,174 |
White River Junction |
Solar |
2,751 |
2166 |
24.00 |
660,240 |
Williamstown |
Solar |
2,540 |
2000 |
30.00 |
762,000 |
Total |
|
62,318 |
|
24.56 |
15,305,067 |
Wholesale cost, midday |
|
62,318 |
|
6.00 |
3,739,080 |
Excess payments |
|
|
|
|
11,565,987 |
Supply to Vermont utilities |
|
6,000,000 |
|
|
|
Solar fraction, % |
|
1.04 |
|
|
|
Auctioned SO PV Solar Projects: The production of the 4 auctioned PV solar projects (8,380 kW) was about 10,897 MWh during the latest 12 months. The average price paid to multi-millionaires owners of these large systems was about 13.26 c/kWh, about 2.2 times the NE annual average midday wholesale price of about 6.0 c/kWh. See table 7.
Owners of the 4 projects could make such low bids, only because the equivalent of about 54% of the turnkey capital cost was ITCs and rapid asset depreciation tax savings during the first 6 years, plus they received high feed-in prices for their production. Without those subsidies, the cost of PV solar in Vermont, and all of NE, would be about 20 c/kWh.
http://www.vermontstandardoffer.com/projects-online/
New England PV Solar Much More Expensive Than Elsewhere: Pro-RE interests are saying PV solar (heavily subsidized) is competitive with fossil in some very sunny areas of the US (Texas, Arizona, New Mexico, etc.), but that is far from reality in not-so-sunny, variably cloudy New England, as proven by energy prices of the 4 auctioned projects (heavily subsidized).
Table 7, Auctioned Projects |
Start |
Type |
Production |
Capacity |
Rate |
Paid |
|
MWh |
kW |
c/kWh |
$/y |
||
Champlain Valley Solar Farm |
Jul 24, 2015 |
Solar |
2,794 |
2000 |
14.41 |
402,615 |
Otter Valley Solar |
Aug 30, 2017 |
Solar |
2,769 |
2180 |
13.38 |
370,492 |
Pownal Park Solar |
Dec 30, 2016 |
Solar |
2,794 |
2200 |
10.96 |
306,222 |
Sudbury Solar |
Apr 18. 2016 |
Solar |
2,540 |
2000 |
14.40 |
365,760 |
Total |
|
10,897 |
8,380 |
13.26 |
1,445,090 |
|
|
|
|
|
|
|
|
Elizabeth Mine |
|
Solar |
8,675 |
7000 DC |
14.90 |
1,292,575 |
Hydro-Quebec A Much Better Alternative Than Wind And Solar: A much better alternative is shown at the end of the article. “Vermont has the option to purchase up to 200 megawatts, but Jessome said he doesn’t expect the state to take advantage of that option.”
Apparently, Green Mountain Power prefers to buy much higher-cost wind and solar energy from a variety of local suppliers. The 200 MW could provide about 1.3 million MWh/y (about 4.8 tines as much as the above SO projects, with no capital investments and subsidies), replacing most of what Vermont lost when Vermont Yankee was shut down in 2014.
https://vtdigger.org/2016/02/09/army-corps-of-engineers-approves-1-...
Hydro-Quebec has about 5600 MW of spare hydro plant capacity, the excess water, now spilling over the spillways, could immediately be used to generate electricity. H-Q has under construction and in planning stages an additional 5000 MW of hydro plant capacity. See URL.
Here a list of the benefits of hydro energy:
- Renewable, as it is made from rainwater.
- Very low in CO2 emissions/kWh, and no particulates, no SOX, no NOX.
- Very low in waste products and environmental impact/kWh, compared to wind and solar.
- Steady, 24/7/365, i.e., NOT variable and NOT intermittent, unlike wind and solar, which are weather dependent, variable cloudiness dependent, night and day dependent, and season dependent unlike wind and solar.
- Provides synchronous rotational inertia for grid stability; wind provides near zero and solar provides none.
- Very low in electricity cost/kWh; in case of New England, about 5 - 7 c/kWh, tied to annual average New England WHOLESALE prices which have averaged about 5 c/kWh for since 2009, due to an abundance of nearby, DOMESTIC, clean-burning, low-CO2-emitting, low-cost, natural gas.
- The output of hydro plants can be quickly varied, at minimal cost, and with no CO2 emissions, to balance any variable wind and solar energy. If natural gas-fired, gas turbines do the peaking, filling-in balancing they have to more frequently start/stop, and inefficiently ramp up/down, at part-load, i.e., more Btu/kWh, more CO2/kWh, more wear and tear/kWh.
- NO federal and state subsidies and investment tax credits.
- NO capital outlays by Vermont’s government.
- NO enriching of multi-millionaires and their lucrative, risk-free, tax shelters.
- NO additional environmental impact in Vermont and Canada.
- Private entities would own the transmission lines from Quebec to New England.
- RECs would not need to be sold to out-of-state entities so they would be wearing the green halo, instead of Vermonters.
- Much less social discord than controversial wind on pristine ridgelines and solar in fertile meadows.
Here are some URLs about increased hydro energy from Hydro Quebec.
http://vtdigger.wpengine.com/2015/01/28/utilities-want-flexibility-...
https://finance.yahoo.com/news/eversource-hydro-qu-bec-offer-170400...
http://www.windtaskforce.org/profiles/blogs/increased-canadian-hydr...
http://www.windtaskforce.org/profiles/blogs/more-energy-from-hydro-...
http://www.windtaskforce.org/profiles/blogs/gmp-refusing-to-buy-add...
Views: 475
Comment
Maine as Third World Country:
CMP Transmission Rate Skyrockets 19.6% Due to Wind Power
Click here to read how the Maine ratepayer has been sold down the river by the Angus King cabal.
Maine Center For Public Interest Reporting – Three Part Series: A CRITICAL LOOK AT MAINE’S WIND ACT
******** IF LINKS BELOW DON'T WORK, GOOGLE THEM*********
(excerpts) From Part 1 – On Maine’s Wind Law “Once the committee passed the wind energy bill on to the full House and Senate, lawmakers there didn’t even debate it. They passed it unanimously and with no discussion. House Majority Leader Hannah Pingree, a Democrat from North Haven, says legislators probably didn’t know how many turbines would be constructed in Maine if the law’s goals were met." . – Maine Center for Public Interest Reporting, August 2010 https://www.pinetreewatchdog.org/wind-power-bandwagon-hits-bumps-in-the-road-3/From Part 2 – On Wind and Oil Yet using wind energy doesn’t lower dependence on imported foreign oil. That’s because the majority of imported oil in Maine is used for heating and transportation. And switching our dependence from foreign oil to Maine-produced electricity isn’t likely to happen very soon, says Bartlett. “Right now, people can’t switch to electric cars and heating – if they did, we’d be in trouble.” So was one of the fundamental premises of the task force false, or at least misleading?" https://www.pinetreewatchdog.org/wind-swept-task-force-set-the-rules/From Part 3 – On Wind-Required New Transmission Lines Finally, the building of enormous, high-voltage transmission lines that the regional electricity system operator says are required to move substantial amounts of wind power to markets south of Maine was never even discussed by the task force – an omission that Mills said will come to haunt the state.“If you try to put 2,500 or 3,000 megawatts in northern or eastern Maine – oh, my god, try to build the transmission!” said Mills. “It’s not just the towers, it’s the lines – that’s when I begin to think that the goal is a little farfetched.” https://www.pinetreewatchdog.org/flaws-in-bill-like-skating-with-dull-skates/
Not yet a member?
Sign up today and lend your voice and presence to the steadily rising tide that will soon sweep the scourge of useless and wretched turbines from our beloved Maine countryside. For many of us, our little pieces of paradise have been hard won. Did the carpetbaggers think they could simply steal them from us?
We have the facts on our side. We have the truth on our side. All we need now is YOU.
“First they ignore you, then they laugh at you, then they fight you, then you win.”
-- Mahatma Gandhi
"It's not whether you get knocked down: it's whether you get up."
Vince Lombardi
Task Force membership is free. Please sign up today!
Hannah Pingree on the Maine expedited wind law
Hannah Pingree - Director of Maine's Office of Innovation and the Future
"Once the committee passed the wind energy bill on to the full House and Senate, lawmakers there didn’t even debate it. They passed it unanimously and with no discussion. House Majority Leader Hannah Pingree, a Democrat from North Haven, says legislators probably didn’t know how many turbines would be constructed in Maine."
https://pinetreewatch.org/wind-power-bandwagon-hits-bumps-in-the-road-3/
© 2026 Created by Webmaster.
Powered by
![]()
You need to be a member of Citizens' Task Force on Wind Power - Maine to add comments!
Join Citizens' Task Force on Wind Power - Maine