Salvation of Electricity as We Know it.
- As temperatures plunge, it is a good time to look at how ISO-NE uses various resources to keep electricity flowing.
- Natural gas has been the dominant fuel since the start of the century and is of extreme importance to the operation of the grid.
- To be sure, solar, wind and battery storage are the conflicting and inconsistent disease-ridden resources sabotaging reliability and costs.
- Natural gas, nuclear and hydro imports from Canada are the only real salvation to the essential energy that electricity has become. We cannot live without dependable electricity, we cannot have abundant and cheap electricity unless the roadblocks to natural gas, nuclear and hydro are immediately removed.
ISO-NE SPELLS IT ALL OUT IN THE FOLLOWING REPORT
Resource Mix
For 25 years, New England’s wholesale electricity markets have attracted billions of dollars in private investment in some of the most efficient, lowest-emitting power resources in the country—providing reliable electricity every second of every day, lowering wholesale prices, shifting costly investment risk away from consumers, and reducing carbon emissions. Because private firms make this investment and not public utilities, consumers are shielded from the investment risks they had been exposed to before the introduction of competitive markets.
Sources of Electricity Used in 2023
Here’s the breakdown of the amount of electricity produced by generators in New England and imported from other regions to satisfy all residential, commercial, and industrial customer demand during 2023. This is called net energy for load (NEL).
Note: Data is preliminary, pending a resettlement period (last update: 01/19/2024.) For the most current information, download the Net Energy and Peak Load by Source spreadsheet.
Fast Stats
- Nearly 400 dispatchable generators
- About 29,700 MW of generating capability
- 99.3% of the region’s electricity in 2023 was provided by natural gas, nuclear, hydro, imported electricity (mostly hydropower from Eastern Canada), and renewables
- About 40,000 MW of new generating capacity, proposed to be built, though many projects ultimately withdraw (source: January 2024, ISO Interconnection Request Queue)
- More than 7,000 MW of generation have retired since 2013 or may retire in the next few years
- About 3,600 MW of demand capacity resources (DCRs)—including active DCRs, energy efficiency, and other passive DCRs—are registered in New England
- About 1,500 MW of imported electricity are obligated to be available for the region—mostly hydropower from Eastern Canada
- About 350,000 distributed solar power installations totaling about 6,500 MW (nameplate), with most connected “behind the meter”
| GIGAWATT-HOURS (GWh) | % of GENERATION | % of NEL | (a) As of January 2016, this chart approximates the amount of generation by individual fuels used by dual-fuel units, such as natural-gas-fired generators that can switch to run on oil and vice versa. Previously, the report attributed generation from such units only to the primary fuel type registered for the unit. The new reporting flows from changes related to the Energy Market Offer Flexibility Project implemented December 2014. See the notes in the Net Energy and Peak Load by Source Report for more details. (b) Hydro is not included in the renewables category primarily because the various sources that make up hydroelectric generation (i.e., conventional hydroelectric, run-of-river, pumped storage) are not universally defined as renewable in the six New England states. (c) “Other” represents resources using a fuel type that does not fall into any of the existing categories. Other may include new technologies or new fuel types that come onto the system but are not yet of sufficient quantity to have their own category. (d) Tie lines are transmission lines that connect two balancing authority areas. A positive value indicates a net import; a negative value represents a net export. (e) The energy used to operate pumped storage plants. (f) Generation |
|
|---|---|---|---|---|
| Total Generation (a) | 101,303 | 100.0% | 87% | |
| Gas | 55,586 | 55% | 49% | |
| Nuclear | 23,204 | 23% | 20% | |
| Renewables | 12,116 | 12% | 11% | |
| Wind | 3,302 | 4% | 3% | |
| Refuse | 2,681 | 3% | 2% | |
| Wood | 1,787 | 2% | 2% | |
| Solar | 3,851 | 4% | 3% | |
| Landfill Gas | 454 | 0.45% | 0.40% | |
| Methane | 41 | 0.04% | 0.04% | |
| Steam | 0 | 0.0% | 0.0% | |
| Hydro (b) | 9,645 | 10% | 8% | |
| Coal | 182 | 0.18% | 0.16% | |
| Oil | 322 | 0.32% | 0.28% | |
| Price-Responsive Demand | 11 | 0.01% | 0.01% | |
| Other (c) | 237 | .23% | .21% | |
| Net Flow over External Ties (d) | 15,104 | 13% | ||
| Québec | 10,548 | |||
| New Brunswick | 1,945 | |||
| New York | 2,611 | |||
| Pumping Load (e) | 1,679 | -1.46% | ||
| Net Energy for Load (f) | 114,727 | 100.00% |
Lower-Emitting Resources Supply Most of the Region’s Electricity
In 2023, natural-gas-fired generation, nuclear, other low- or no-emission sources, and imported electricity (mostly hydropower from Eastern Canada) provided most of the region’s electricity.
When the wholesale markets opened to competition in 2003, private companies invested billions of dollars in the development of natural-gas-fired power plants because they used advanced technology that made them run efficiently; were relatively inexpensive to build, site, and interconnect; and their lower carbon emissions compared to coal and oil helped the region meet state environmental policies. As nearby shale gas emerged as an inexpensive and plentiful fuel resource around 2008, natural-gas-fired generators became the go-to resource for New England, clearing as the largest resource type in the market year after year. Nearly half of the region’s electric generating capacity uses natural gas as its primary fuel (about 14,000 MW in 2024), and natural-gas-fired power plants produce about half of the grid electricity consumed in a year (about 55,600 GWh in 2023).
Markets Respond to Changing Times: Resources on the Way OUT
In contrast, aging coal-fired, oil-fired, and nuclear power plants have been closing largely because their operating, fuel, and environmental-compliance costs make them too expensive to compete against lower-cost resources. Since 2013, more than 7,000 MW of mostly coal, oil, and nuclear generation have retired or have announced plans for retirement in the coming years.
Competition in the markets brought about this change at a faster pace than under the traditional industry model. Under wholesale markets, private companies have carried the risks of uneconomic investments, not utilities and their customers. Consumers have benefited from this least-cost resource mix created through competitive markets.
The region’s remaining two zero-carbon-emitting nuclear facilities, Millstone and Seabrook, supply a quarter of the electricity New England consumes in a year and will be critical components of a reliable clean energy grid because they are carbon-free and have a dependable, on-site fuel supply.
Notable exits include:
- 2021: Bridgeport Harbor Station Unit 3, Connecticut (383 MW from coal)
- 2019: Pilgrim Nuclear Station, Massachusetts (677 MW from nuclear power)
- 2018: Mount Tom Station, Massachusetts (143 MW from coal)
- 2017: Brayton Point Station, Massachusetts (1,535 MW from oil and coal)
- 2017: Norwalk Harbor Station, Connecticut (342 MW from oil)
- 2014: Salem Harbor Station, Massachusetts (749 MW from oil and coal)
- 2013: Vermont Yankee (604 MW from nuclear power)
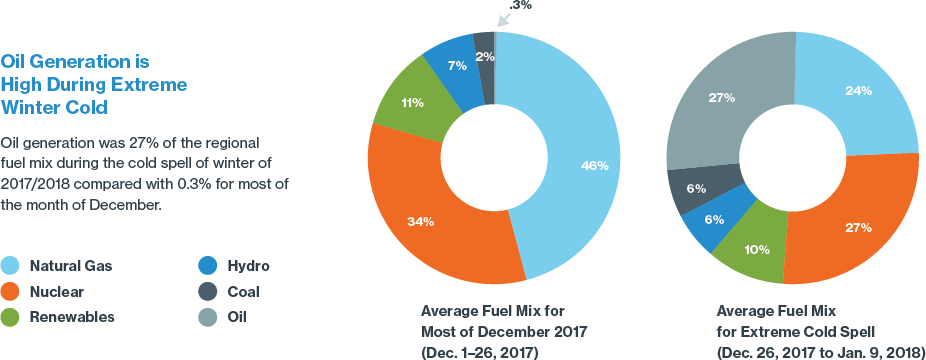
Nuclear, oil, and coal generators are critical on the coldest winter days when natural gas supply is constrained (as shown below). Coal- and oil-fired resources also make valuable contributions on the hottest days of summer when demand is very high or major resources are unavailable. As more and more conventional, thermal generation facilities that store fuel on site retire, the system is increasingly made up of generating facilities that run on “just-in-time” energy sources: natural gas (from pipelines and LNG deliveries), wind, and solar energy.
With limited options for storing natural gas, most natural-gas-fired plants rely on just-in-time fuel delivered to New England through interstate pipelines. However, interstate pipeline infrastructure has only expanded incrementally over the last several decades, even as reliance on natural gas for home heating and for power generation has grown significantly. During cold weather, most natural gas is committed to local utilities for residential, commercial, and industrial heating. As a result, during severe winter weather many power plants in New England cannot obtain fuel to generate electricity. Liquefied natural gas (LNG), brought to New England by ship from overseas, can help fill the gap—but regional LNG storage and sendout capability is limited, and its timely arrival depends on long-term weather forecasts, global market prices, and other logistical challenges.
Winter also poses the greatest challenges for solar output in New England due to snow, clouds, and shortened daylight hours. In addition, shortened winter days means consumers use the most electricity after sunset, and therefore solar doesn’t reduce winter peak demand. While offshore wind experiences its highest production during winter, winter storms that limit solar power can also significantly limit the output of wind generation if high wind speeds force plant operators to shut down in order to protect equipment. This type of variability is a n understandable challenge in meeting the states’ decarbonization goals through greater renewable, weather-dependent technologies, and it poses new technical challenges to the grid’s reliability.
Tomorrow’s Energy Mix: Resources on the Way IN
All six New England states have renewable portfolio standards, which require electricity suppliers to provide customers with increasing percentages of renewable energy.
State Renewable Portfolio Standards Are Rising
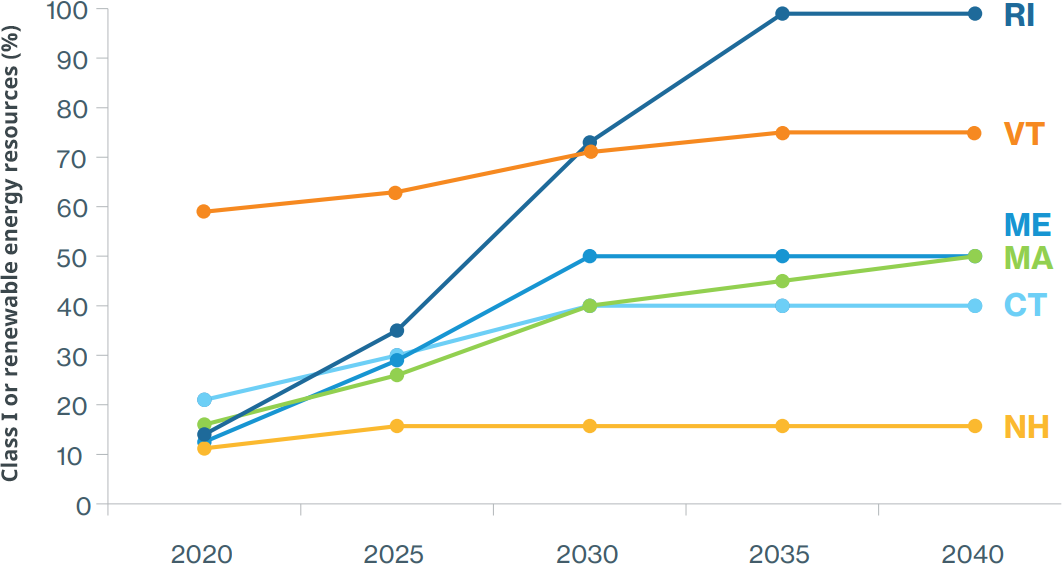
Notes: State RPS requirements promote the development of renewable energy resources by requiring electricity providers (electric distribution companies and competitive suppliers) to serve a minimum percentage of their retail load using renewable energy. Connecticut’s Class I RPS requirement plateaus at 40% in 2030. Maine’s Class I/IA RPS requirement increases to 50% in 2030 and remains at that level each year thereafter. Massachusetts’ Class I RPS requirement increases by 2% each year between 2020 and 2024, 3% each year between 2025 and 2029, reverting back to 1% each year thereafter, with no stated expiration date. New Hampshire’s percentages include the requirements for both Class I and Class II resources (Class II resources are new solar technologies beginning operation after January 1, 2006). New Hampshire’s Class I and Class II RPS requirements plateau at 15.7% in 2025. Rhode Island’s requirement for ‘new’ renewable energy reaches 100% in 2033. Vermont’s ‘total renewable energy’ requirement plateaus at 75% in 2032; it recognizes all forms of new and existing renewable energy and is unique in classifying large-scale hydropower as renewable.
Greenhouse gas reductions are promoted on a state-by-state basis and at the regional level through a combination of legislative mandates and aspirational goals.
With deadlines looming, the states are eager for the quicker transformation of the power grid to renewables and for electrification of the broader economy. Because large-scale renewable resources typically have higher up-front capital costs and different financing opportunities than more conventional resources, they have had difficulty competing in the wholesale markets. Therefore, the New England states are promoting, at varying levels and speed, the development of specific clean-energy resources to meet their public policy goals.
Several states have established public policies that direct electric power companies to enter into ratepayer-funded, long-term contracts for large-scale carbon-free energy that would cover most, if not all, of the resource’s costs. Long-term contracts carry risk given the rapid development and falling costs of new technologies—and this risk of stranded costs is placed back on consumers. As policymakers seek to convert the transportation and heating sectors to electricity to fully meet climate goals, this public policy trend is expected to continue.
Developers of clean-energy resources are taking advantage of state incentives, declining technology costs, and revenues from the wholesale markets. About 97% of resources currently proposed for the region are grid-scale wind, solar, and battery projects. As of January 2024, about 40,000 MW have been proposed in the ISO New England Interconnection Request Queue.
Views: 39
Comment
Maine as Third World Country:
CMP Transmission Rate Skyrockets 19.6% Due to Wind Power
Click here to read how the Maine ratepayer has been sold down the river by the Angus King cabal.
Maine Center For Public Interest Reporting – Three Part Series: A CRITICAL LOOK AT MAINE’S WIND ACT
******** IF LINKS BELOW DON'T WORK, GOOGLE THEM*********
(excerpts) From Part 1 – On Maine’s Wind Law “Once the committee passed the wind energy bill on to the full House and Senate, lawmakers there didn’t even debate it. They passed it unanimously and with no discussion. House Majority Leader Hannah Pingree, a Democrat from North Haven, says legislators probably didn’t know how many turbines would be constructed in Maine if the law’s goals were met." . – Maine Center for Public Interest Reporting, August 2010 https://www.pinetreewatchdog.org/wind-power-bandwagon-hits-bumps-in-the-road-3/From Part 2 – On Wind and Oil Yet using wind energy doesn’t lower dependence on imported foreign oil. That’s because the majority of imported oil in Maine is used for heating and transportation. And switching our dependence from foreign oil to Maine-produced electricity isn’t likely to happen very soon, says Bartlett. “Right now, people can’t switch to electric cars and heating – if they did, we’d be in trouble.” So was one of the fundamental premises of the task force false, or at least misleading?" https://www.pinetreewatchdog.org/wind-swept-task-force-set-the-rules/From Part 3 – On Wind-Required New Transmission Lines Finally, the building of enormous, high-voltage transmission lines that the regional electricity system operator says are required to move substantial amounts of wind power to markets south of Maine was never even discussed by the task force – an omission that Mills said will come to haunt the state.“If you try to put 2,500 or 3,000 megawatts in northern or eastern Maine – oh, my god, try to build the transmission!” said Mills. “It’s not just the towers, it’s the lines – that’s when I begin to think that the goal is a little farfetched.” https://www.pinetreewatchdog.org/flaws-in-bill-like-skating-with-dull-skates/
Not yet a member?
Sign up today and lend your voice and presence to the steadily rising tide that will soon sweep the scourge of useless and wretched turbines from our beloved Maine countryside. For many of us, our little pieces of paradise have been hard won. Did the carpetbaggers think they could simply steal them from us?
We have the facts on our side. We have the truth on our side. All we need now is YOU.
“First they ignore you, then they laugh at you, then they fight you, then you win.”
-- Mahatma Gandhi
"It's not whether you get knocked down: it's whether you get up."
Vince Lombardi
Task Force membership is free. Please sign up today!
Hannah Pingree on the Maine expedited wind law
Hannah Pingree - Director of Maine's Office of Innovation and the Future
"Once the committee passed the wind energy bill on to the full House and Senate, lawmakers there didn’t even debate it. They passed it unanimously and with no discussion. House Majority Leader Hannah Pingree, a Democrat from North Haven, says legislators probably didn’t know how many turbines would be constructed in Maine."
https://pinetreewatch.org/wind-power-bandwagon-hits-bumps-in-the-road-3/
© 2026 Created by Webmaster.
Powered by
![]()
You need to be a member of Citizens' Task Force on Wind Power - Maine to add comments!
Join Citizens' Task Force on Wind Power - Maine