Most of the articles I have produced on subsidies for renewables have focused on the Contract for Difference (CfD) regime. This is because this is the active regime and most new renewables projects are commissioned under this regime. However, whilst producing last week’s article that updated the hidden cost of renewables, I noticed that the cost of the old Renewables Obligation Certificate (ROC) regime was far higher than the CfD regime. This prompted me to delve into the ROC data and see what insights could be gleaned.
The ROC system was designed to encourage the development of electricity from renewables. The scheme came into effect in 2002 in Great Britain and Northern Ireland followed in 2005.
ROCs are issued to operators of accredited renewable electricity generators for the power they produce. The number of ROCs per MWH generated varies by the type of generator. For instance, offshore wind attracts more ROCs per unit than onshore wind or biomass. It is also worth noting that the number of ROCs issued per MWh has changed during the life of the scheme.
Generators generally receive contracts for 20 years. The scheme was closed to new capacity in 2017 and replaced by the Contracts for Difference (CfD) scheme. However, there is a legacy of generators still operating under the ROC regime. Over time, the early generators will start to drop out of the scheme, but many developments will continue to receive subsidy up to 2037.
The scheme places an obligation on electricity suppliers (like Octopus or Eon) to present to Ofgem a specified number of ROCs per MWh of electricity supplied to their customers. Suppliers can meet their annual obligation by presenting ROCs, by paying into a buy-out fund or a combination of the two. The suppliers can buy ROCs from operators of renewables generators or from third-party traders.
Each scheme year, the value or buy-out price of a Renewable Obligation Certificate is indexed upwards by the Retail Price Index (RPI). The buy-out price for financial year 2023/24 is £59.01.
The combination of the value of a ROC certificate and the different ROC awards per MWh by technology means that different generating technologies receive different levels of subsidy per MWh. Note also that the subsidy they receive is in addition to what ever price they achieve for the electricity they sell on to the market. As the market price is frequently set by the price of gas-fired electricity, then by definition all these renewable generators are more expensive than gas.
Overall Volume of ROCs Issued and RO Generation
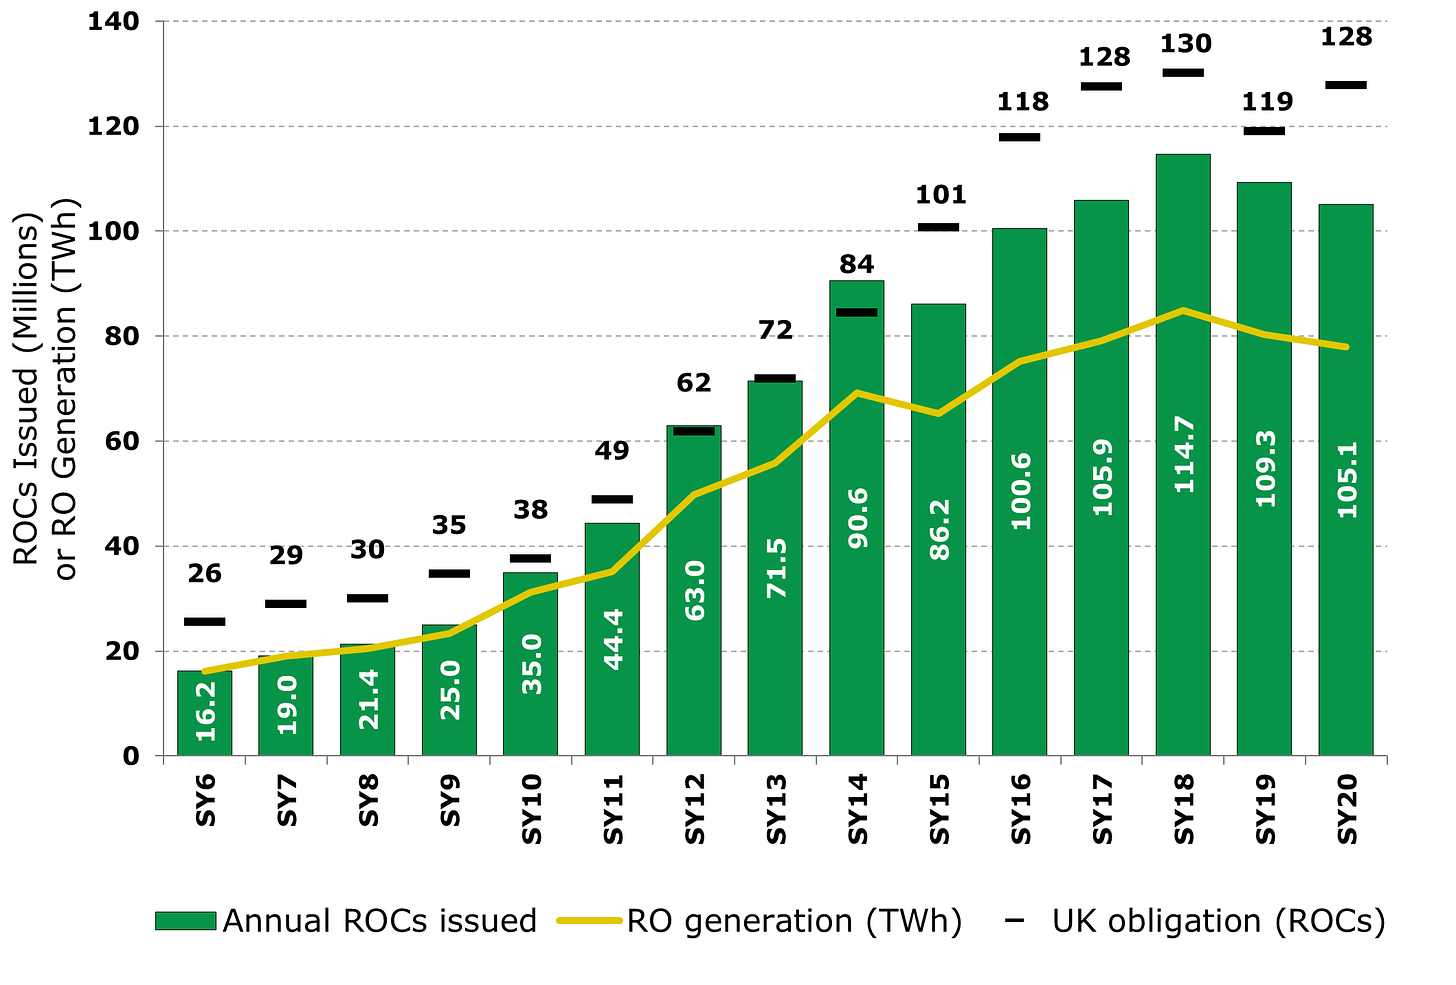
Each year, Ofgem publish a report and dataset on the performance of the Renewables Obligation Scheme. Figure 1 below (their Figure 3.4) shows how the number of ROCs issued and the amount of electricity generated each year.
Figure 1 - Annual ROCs Issued (m) and Electricity Generated (TWh) from Ofgem Annual ROC report Figure 3.4
The x-axis is expressed in System Years. SY20 is system year 20, which corresponds to the financial year ended 31st March 2022. We can see that the number of ROCs issued rose steadily up to SY18 (FY ended March 2020) but has since dropped back slightly. The amount of electricity generated also peaked in SY18 at nearly 85TWh but fell back to 78TWh in SY20.
Value of the ROC Scheme
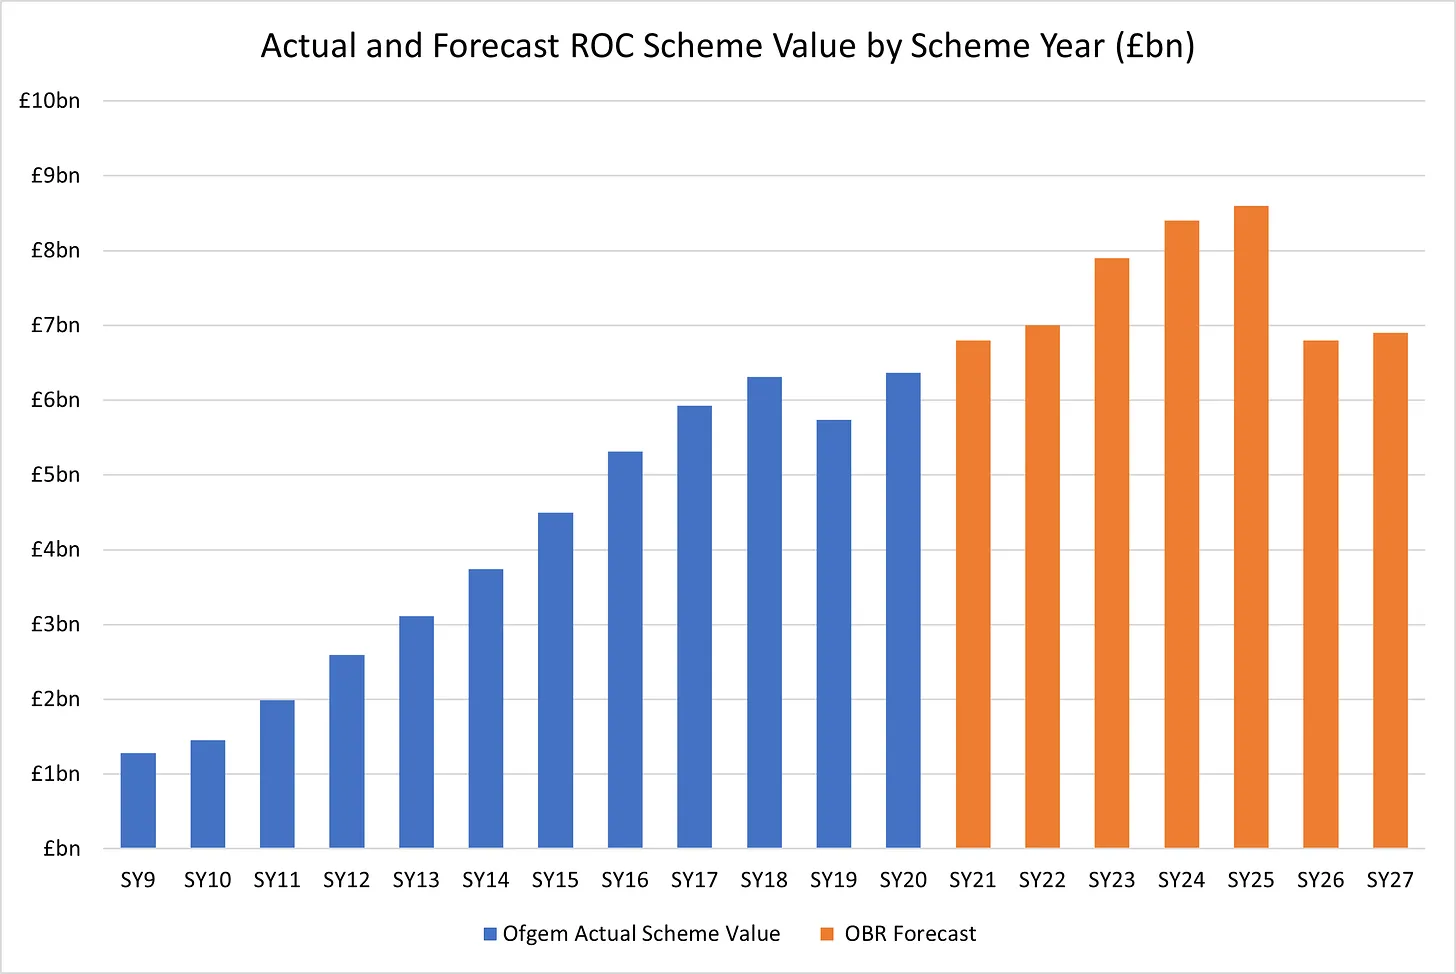
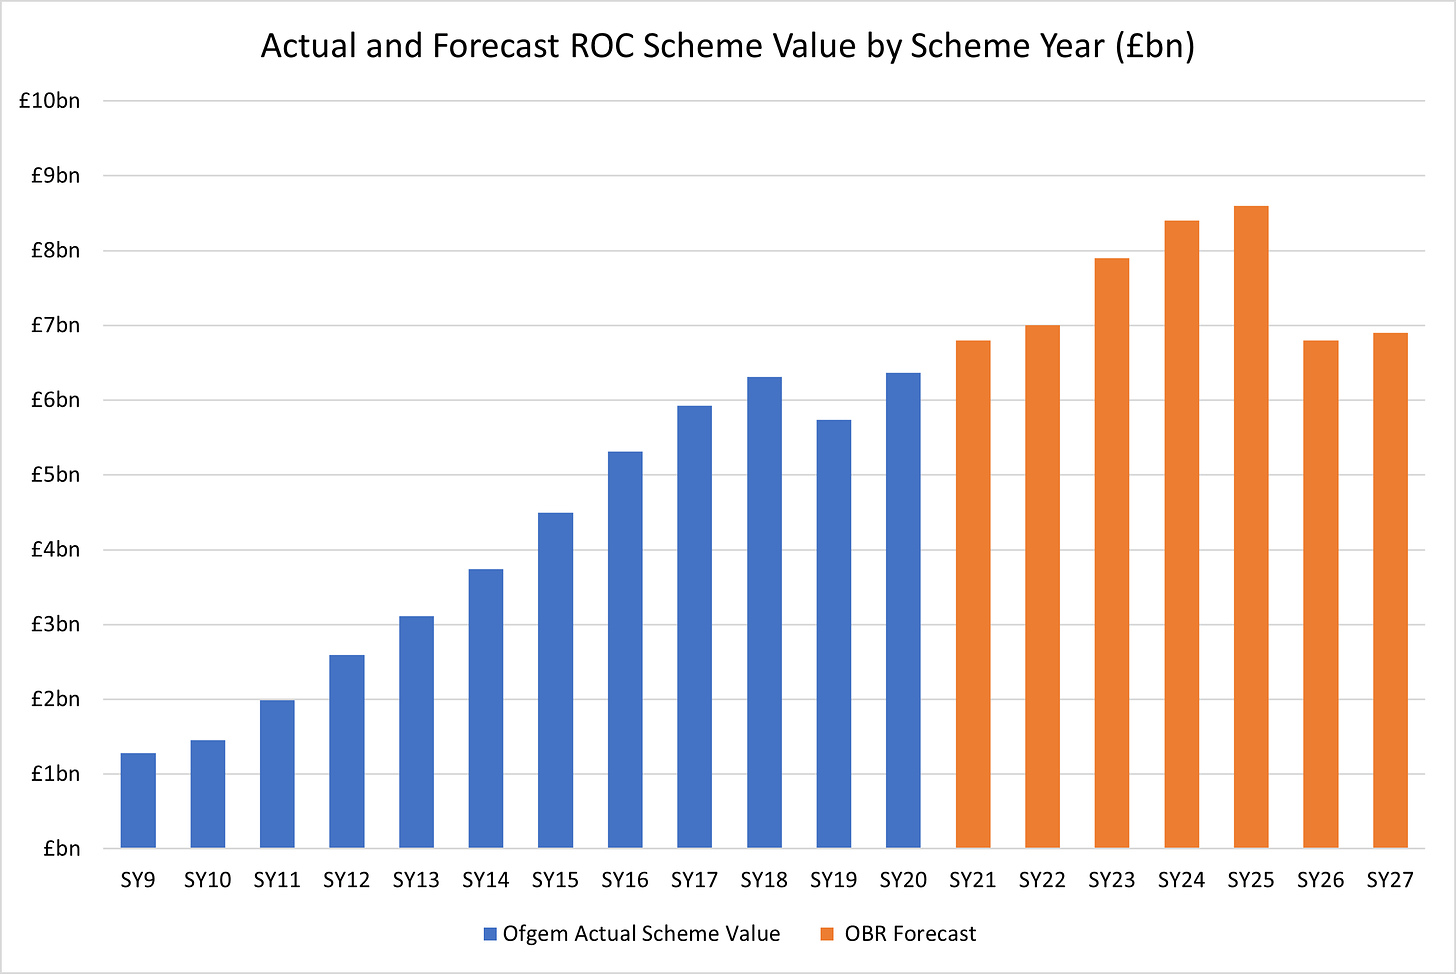
Figure 5.10 of the Ofgem dataset shows the value of the ROC scheme for each year since SY9 (FY ended March 2011). The OBR also estimates the future value of the scheme out to March 2029. Figure 2 below combines the Ofgem and OBR data to show the history of the scheme value and the forecast of the future.
https://substackcdn.com/image/fetch/w_848,c_limit,f_webp,q_auto:good,fl_progressive:steep/https%3A%2F%2Fsubstack-post-media.s3.amazonaws.com%2Fpublic%2Fimages%2Fdd9b731d-1250-4465-90da-f525ff0c799e_2477x1657.png 848w, https://substackcdn.com/image/fetch/w_1272,c_limit,f_webp,q_auto:go... 1272w, https://substackcdn.com/image/fetch/w_1456,c_limit,f_webp,q_auto:go... 1456w" sizes="100vw" />https://substack-post-media.s3.amazonaws.com/public/images/dd9b731d-1250-4465-90da-f525ff0c799e_2477x1657.png","srcNoWatermark":null,"fullscreen":null,"imageSize":null,"height":974,"width":1456,"resizeWidth":null,"bytes":61879,"alt":"Figure 2 - Actual and Forecast ROC Scheme Value by Scheme Year (£bn)","title":null,"type":"image/png","href":null,"belowTheFold":true,"topImage":false,"internalRedirect":null}" class="sizing-normal" alt="Figure 2 - Actual and Forecast ROC Scheme Value by Scheme Year (£bn)" title="Figure 2 - Actual and Forecast ROC Scheme Value by Scheme Year (£bn)" srcset="https://substackcdn.com/image/fetch/w_424,c_limit,f_auto,q_auto:good,fl_progressive:steep/https%3A%2F%2Fsubstack-post-media.s3.amazonaws.com%2Fpublic%2Fimages%2Fdd9b731d-1250-4465-90da-f525ff0c799e_2477x1657.png 424w, https://substackcdn.com/image/fetch/w_848,c_limit,f_auto,q_auto:goo... 848w, https://substackcdn.com/image/fetch/w_1272,c_limit,f_auto,q_auto:go... 1272w, https://substackcdn.com/image/fetch/w_1456,c_limit,f_auto,q_auto:go... 1456w" sizes="100vw" loading="lazy" />
Figure 2 - Actual and Forecast ROC Scheme Value by Scheme Year (£bn)
As can be seen, the value of the scheme rose steadily up to SY18 (March 2020), dipped back in SY19 and then reach a new peak in SY20 of £6.4bn. The OBR forecasts the value of the scheme to continue to rise and peak in SY25 (March 2027) at £8.6bn before falling back in subsequent years. Presumably, some ROC generators start to become ineligible for support after March 2027. The value in SY21 (year ended March 2023) was £6.8bn. Assuming 28.2m households in the UK, this equates to ~£241 per household, just for the ROC scheme. If the number of households remains constant, the ROC scheme will cost ~£305 per household in SY25.
Split of ROCs Issued by Technology
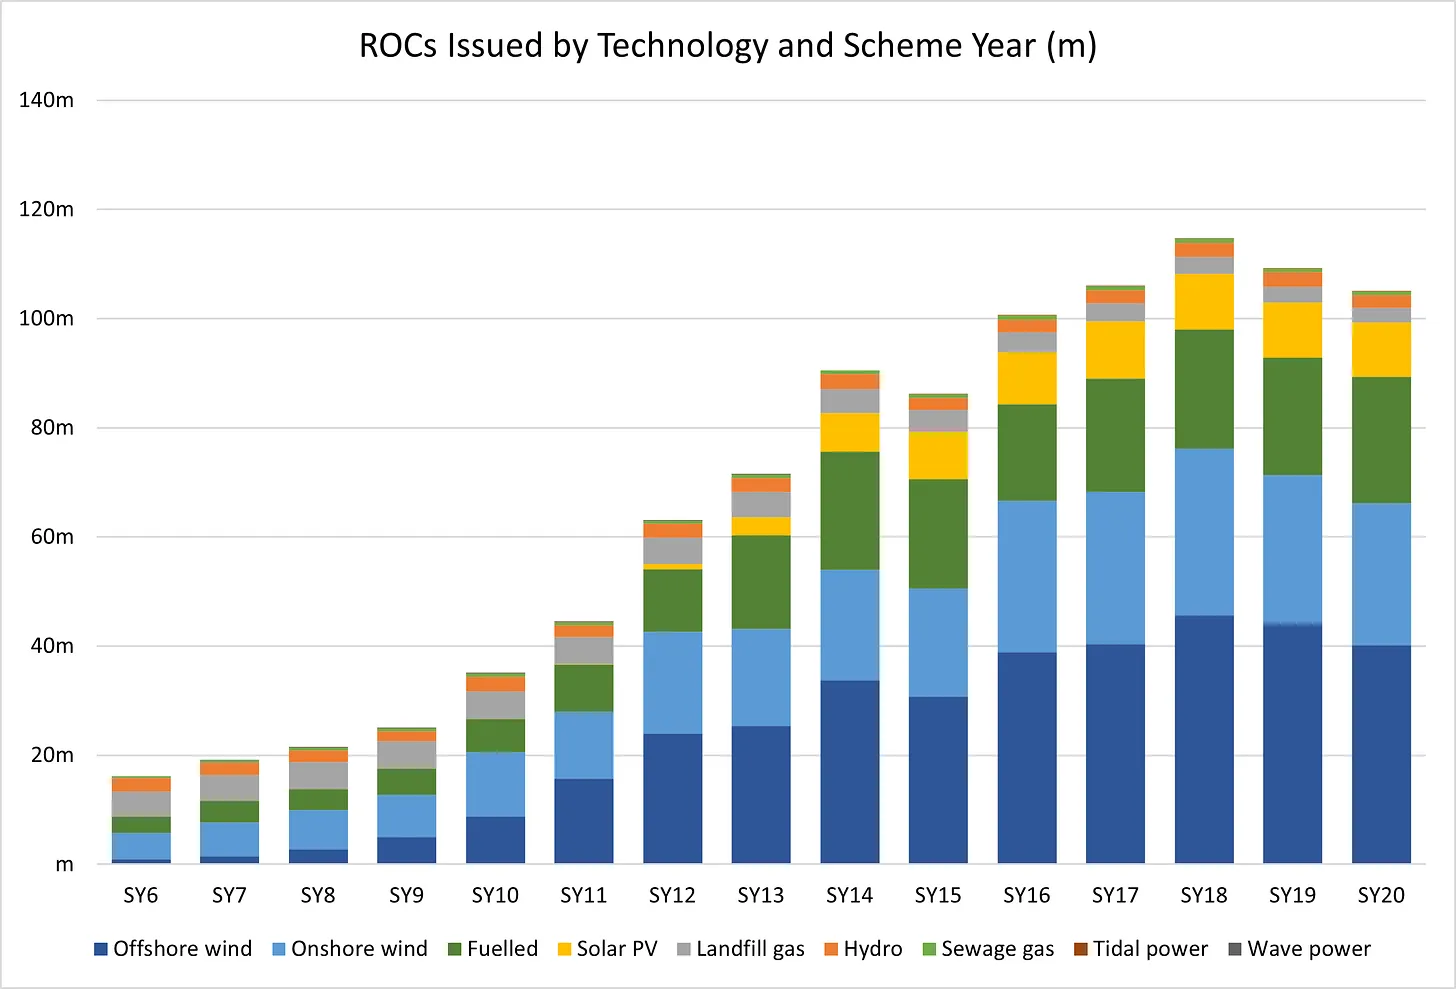
Figure 3 shows reproduces data in Ofgem’s Figure 3.6 to show the number of ROCs issued by technology type each year. The number of ROCs received is directly proportional to the amount of money received because each RO certificate has the same buy-out value.
https://substackcdn.com/image/fetch/w_848,c_limit,f_webp,q_auto:good,fl_progressive:steep/https%3A%2F%2Fsubstack-post-media.s3.amazonaws.com%2Fpublic%2Fimages%2F888dbd38-ab14-41a5-9d2a-5632466ad5f7_2490x1691.png 848w, https://substackcdn.com/image/fetch/w_1272,c_limit,f_webp,q_auto:go... 1272w, https://substackcdn.com/image/fetch/w_1456,c_limit,f_webp,q_auto:go... 1456w" sizes="100vw" />https://substack-post-media.s3.amazonaws.com/public/images/888dbd38-ab14-41a5-9d2a-5632466ad5f7_2490x1691.png","srcNoWatermark":null,"fullscreen":null,"imageSize":null,"height":989,"width":1456,"resizeWidth":null,"bytes":58502,"alt":"Figure 3 - ROCs Issued by Technology and Scheme Year (m)","title":null,"type":"image/png","href":null,"belowTheFold":true,"topImage":false,"internalRedirect":null}" class="sizing-normal" alt="Figure 3 - ROCs Issued by Technology and Scheme Year (m)" title="Figure 3 - ROCs Issued by Technology and Scheme Year (m)" srcset="https://substackcdn.com/image/fetch/w_424,c_limit,f_auto,q_auto:good,fl_progressive:steep/https%3A%2F%2Fsubstack-post-media.s3.amazonaws.com%2Fpublic%2Fimages%2F888dbd38-ab14-41a5-9d2a-5632466ad5f7_2490x1691.png 424w, https://substackcdn.com/image/fetch/w_848,c_limit,f_auto,q_auto:goo... 848w, https://substackcdn.com/image/fetch/w_1272,c_limit,f_auto,q_auto:go... 1272w, https://substackcdn.com/image/fetch/w_1456,c_limit,f_auto,q_auto:go... 1456w" sizes="100vw" loading="lazy" />
Figure 3 - ROCs Issued by Technology and Scheme Year (m)
The largest recipient of ROCs is offshore wind followed by onshore wind, fuelled generation and solar. The other technologies make up only a small part of the overall ROC scheme. Fuelled generation is mostly biomass, but the category also includes technologies such as anaerobic digestion and dedicated energy crops.
Anyone holding out for tidal or wave power to generate significant amounts of electricity is going to have to wait a long time. The last wave power was produced under the ROC scheme in FY14/15 (SY13) and only trivial amounts of tidal power are being generated by three small projects in Scotland.
Support (Subsidy) per MWh
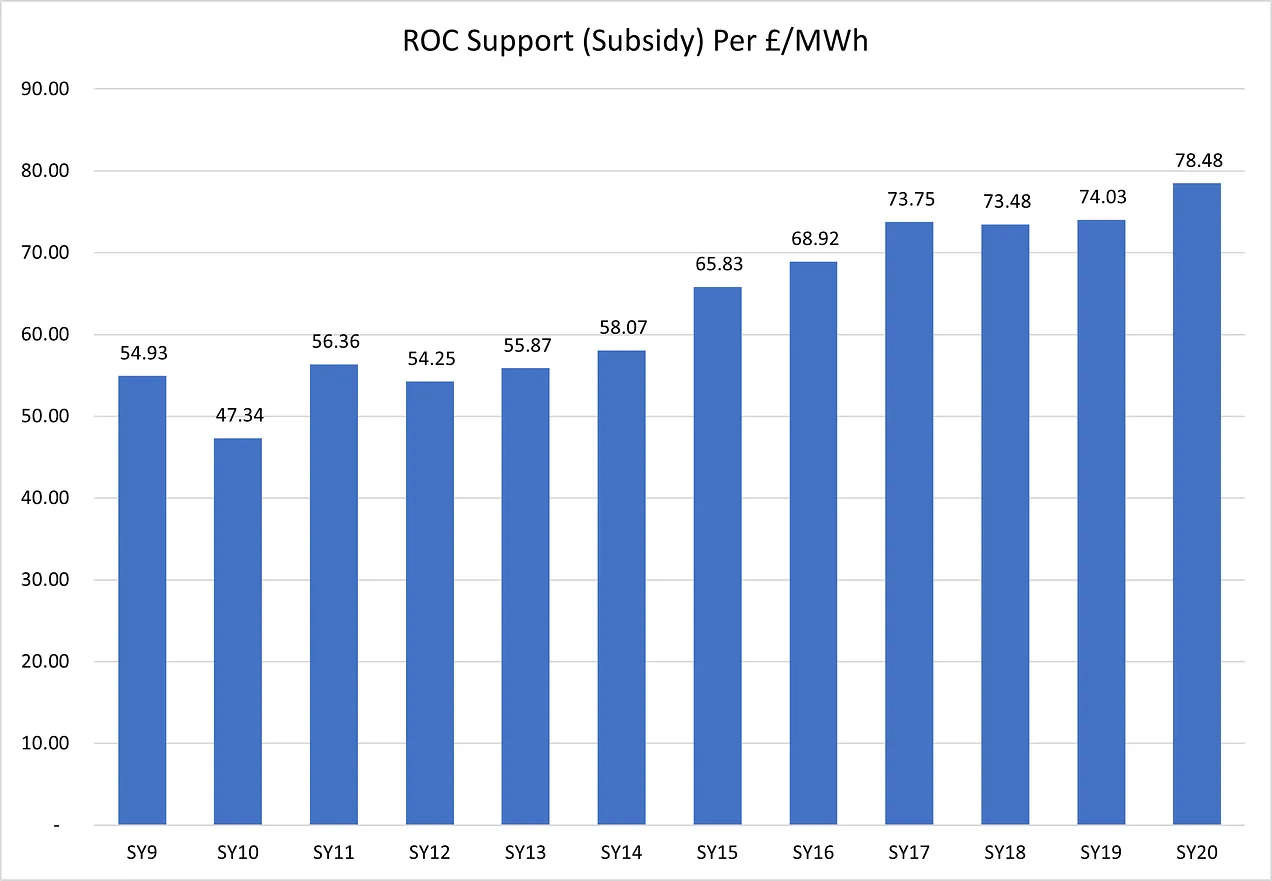
Figure 4 below reproduces data from Ofgem’s Figure 5.10 that calculates the support (subsidy) per MWh of electricity supplied.
https://substackcdn.com/image/fetch/w_848,c_limit,f_webp,q_auto:good,fl_progressive:steep/https%3A%2F%2Fsubstack-post-media.s3.amazonaws.com%2Fpublic%2Fimages%2F46511580-1835-41e7-9c03-d2cdaa5b52d7_2463x1705.png 848w, https://substackcdn.com/image/fetch/w_1272,c_limit,f_webp,q_auto:go... 1272w, https://substackcdn.com/image/fetch/w_1456,c_limit,f_webp,q_auto:go... 1456w" sizes="100vw" />https://substack-post-media.s3.amazonaws.com/public/images/46511580-1835-41e7-9c03-d2cdaa5b52d7_2463x1705.png","srcNoWatermark":null,"fullscreen":null,"imageSize":null,"height":1008,"width":1456,"resizeWidth":null,"bytes":61846,"alt":"Figure 4 - ROC Support (Subsidy) per MWh Generated (£ per MWh) by Year","title":null,"type":"image/png","href":null,"belowTheFold":true,"topImage":false,"internalRedirect":null}" class="sizing-normal" alt="Figure 4 - ROC Support (Subsidy) per MWh Generated (£ per MWh) by Year" title="Figure 4 - ROC Support (Subsidy) per MWh Generated (£ per MWh) by Year" srcset="https://substackcdn.com/image/fetch/w_424,c_limit,f_auto,q_auto:good,fl_progressive:steep/https%3A%2F%2Fsubstack-post-media.s3.amazonaws.com%2Fpublic%2Fimages%2F46511580-1835-41e7-9c03-d2cdaa5b52d7_2463x1705.png 424w, https://substackcdn.com/image/fetch/w_848,c_limit,f_auto,q_auto:goo... 848w, https://substackcdn.com/image/fetch/w_1272,c_limit,f_auto,q_auto:go... 1272w, https://substackcdn.com/image/fetch/w_1456,c_limit,f_auto,q_auto:go... 1456w" sizes="100vw" loading="lazy" />
Figure 4 - ROC Support (Subsidy) per MWh Generated (£ per MWh) by Year
The subsidies per MWh were lowest in the year to March 2012 (SY10) at £47.34/MWh. The subsidy levels have crept up almost each year to reach £78.48/MWh in SY20. Remember, this subsidy is in addition to the price the generators receive from the market for their electricity. At the time of writing the day-ahead price for electricity is £65.10/MWh, meaning on average generators are receiving subsidies greater than the value of the power they produce.
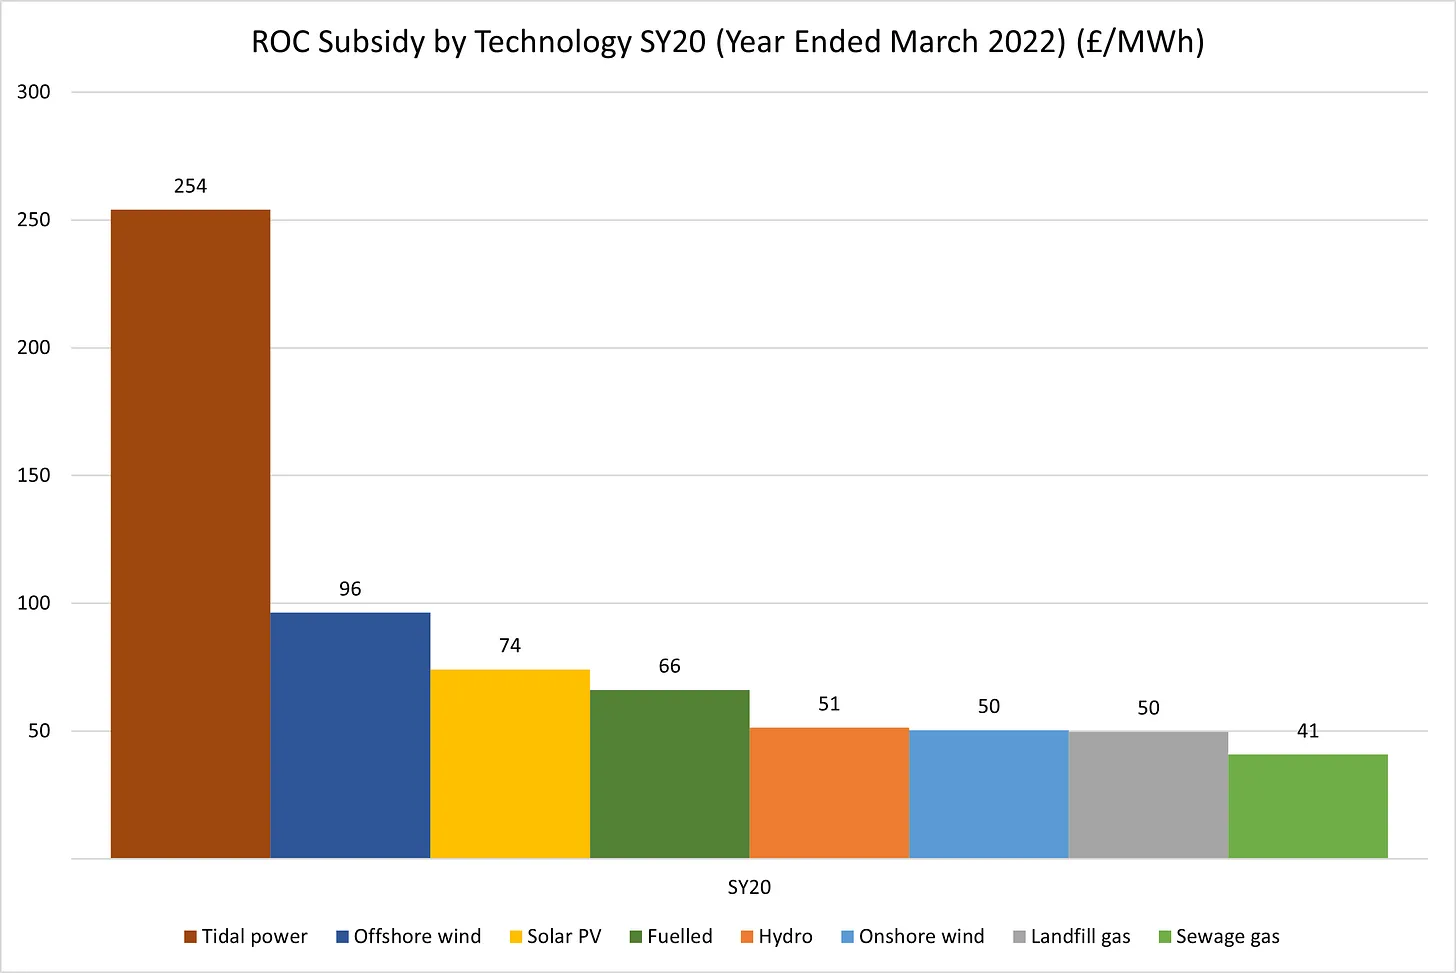
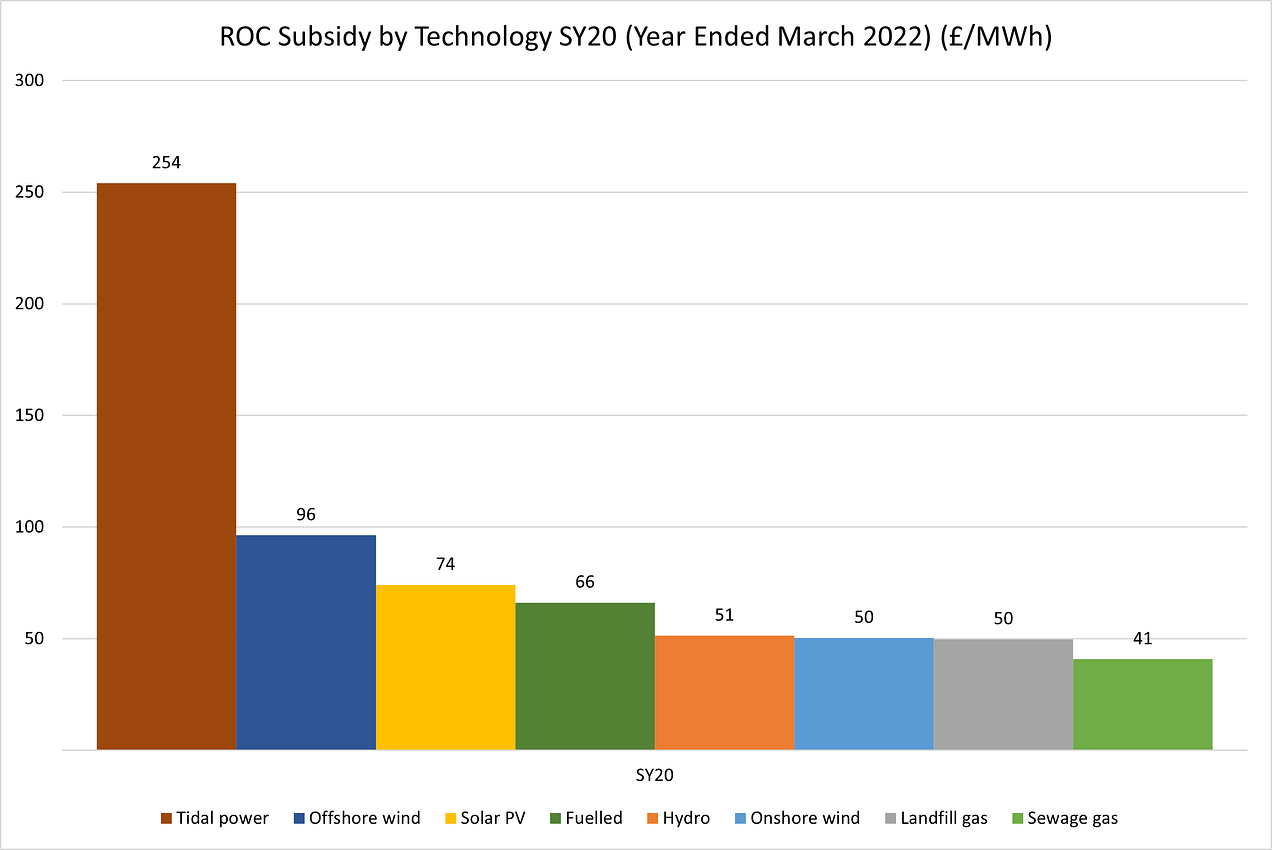
Figure 5 shows the average subsidy per generation technology, calculated by combining the data in Ofgem’s Figure 3.6 and the ROC buy-out price for SY20.
https://substackcdn.com/image/fetch/w_848,c_limit,f_webp,q_auto:good,fl_progressive:steep/https%3A%2F%2Fsubstack-post-media.s3.amazonaws.com%2Fpublic%2Fimages%2F0672650f-7119-45c4-a2da-5a5125eac264_2710x1811.png 848w, https://substackcdn.com/image/fetch/w_1272,c_limit,f_webp,q_auto:go... 1272w, https://substackcdn.com/image/fetch/w_1456,c_limit,f_webp,q_auto:go... 1456w" sizes="100vw" />https://substack-post-media.s3.amazonaws.com/public/images/0672650f-7119-45c4-a2da-5a5125eac264_2710x1811.png","srcNoWatermark":null,"fullscreen":null,"imageSize":null,"height":973,"width":1456,"resizeWidth":null,"bytes":49027,"alt":"Figure 5 - Subsidy by Technology SY20 (Year ended March 2022) (£ per MWh)","title":null,"type":"image/png","href":null,"belowTheFold":true,"topImage":false,"internalRedirect":null}" class="sizing-normal" alt="Figure 5 - Subsidy by Technology SY20 (Year ended March 2022) (£ per MWh)" title="Figure 5 - Subsidy by Technology SY20 (Year ended March 2022) (£ per MWh)" srcset="https://substackcdn.com/image/fetch/w_424,c_limit,f_auto,q_auto:good,fl_progressive:steep/https%3A%2F%2Fsubstack-post-media.s3.amazonaws.com%2Fpublic%2Fimages%2F0672650f-7119-45c4-a2da-5a5125eac264_2710x1811.png 424w, https://substackcdn.com/image/fetch/w_848,c_limit,f_auto,q_auto:goo... 848w, https://substackcdn.com/image/fetch/w_1272,c_limit,f_auto,q_auto:go... 1272w, https://substackcdn.com/image/fetch/w_1456,c_limit,f_auto,q_auto:go... 1456w" sizes="100vw" loading="lazy" />
Figure 5 - Subsidy by Technology SY20 (Year ended March 2022) (£ per MWh)
Tidal power attracts by far the greatest subsidy per MWh, so it is just as well that technology is not producing much. Offshore wind is the next most subsidised technology at £96/MWh followed by solar PV at £74/MWh. Fuelled generation (mostly burning trees) attracts £66/MWh subsidy and onshore wind receives £50/MWh. It looks like landfill gas and sewage gas are much more expensive than gas obtained by conventional means as they attract significant subsides of £50 and £41/MWh respectively.
Top-10 Recipients of ROC Subsidies
After downloading the database of ROCs from the Ofgem data portal, it was possible to generate a Top-10 of the generators that received the most subsidy in year ended March 2023. This is calculated by multiplying the RO certificates issued in the year by the buy-out price for the year. The result is shown in Figure 6.
https://substackcdn.com/image/fetch/w_848,c_limit,f_webp,q_auto:good,fl_progressive:steep/https%3A%2F%2Fsubstack-post-media.s3.amazonaws.com%2Fpublic%2Fimages%2Fa669d653-f02b-445a-954b-62f5fe683a07_2615x1749.png 848w, https://substackcdn.com/image/fetch/w_1272,c_limit,f_webp,q_auto:go... 1272w, https://substackcdn.com/image/fetch/w_1456,c_limit,f_webp,q_auto:go... 1456w" sizes="100vw" />https://substack-post-media.s3.amazonaws.com/public/images/a669d653-f02b-445a-954b-62f5fe683a07_2615x1749.png","srcNoWatermark":null,"fullscreen":null,"imageSize":null,"height":974,"width":1456,"resizeWidth":null,"bytes":65183,"alt":"Figure 6 - Top-10 Subsidy Generators in Year to end March 2023 (£m)","title":null,"type":"image/png","href":null,"belowTheFold":true,"topImage":false,"internalRedirect":null}" class="sizing-normal" alt="Figure 6 - Top-10 Subsidy Generators in Year to end March 2023 (£m)" title="Figure 6 - Top-10 Subsidy Generators in Year to end March 2023 (£m)" srcset="https://substackcdn.com/image/fetch/w_424,c_limit,f_auto,q_auto:good,fl_progressive:steep/https%3A%2F%2Fsubstack-post-media.s3.amazonaws.com%2Fpublic%2Fimages%2Fa669d653-f02b-445a-954b-62f5fe683a07_2615x1749.png 424w, https://substackcdn.com/image/fetch/w_848,c_limit,f_auto,q_auto:goo... 848w, https://substackcdn.com/image/fetch/w_1272,c_limit,f_auto,q_auto:go... 1272w, https://substackcdn.com/image/fetch/w_1456,c_limit,f_auto,q_auto:go... 1456w" sizes="100vw" loading="lazy" />
Figure 6 - Top-10 Subsidy Generators in Year to end March 2023 (£m)
Drax is by far the largest recipient of ROC subsidy largesse, receiving around £550m worth of ROC certificated in FY22/23. The other nine in the Top-10 are all offshore wind farms, receiving £100-220m of ROC subsidies in the year. The Top-10 represent about one third of the total value of ROCs issued for the year.
Conclusions
It was remiss for me to overlook the ROC scheme up to now. However, this deep dive demonstrates that renewables produced under ROC schemes are not cheap and never will be cheap. Generators receive a subsidy in addition to the market value of the electricity they sell. As the market value is frequently set by gas-fired generators, the renewables generators are bound to be more expensive. By far the biggest recipients of ROC subsidy largesse are the tree-burners at Drax and offshore and onshore wind farms
The OBR forecasts that the costs of the ROC scheme are going to continue to rise until 2027, so there will be no let up in the price we pay for this scheme. In fact, if the OBR is right the ROC scheme will cost the equivalent of over £300 per household by 2027. If the Government is serious about reducing the impact of Net Zero on consumers, it needs to find a way of cutting back the ROC system before it bankrupts us all.
If you have enjoyed this article, please share it with your family, friends and colleagues and sign up to receive more content.
Comment by Willem Post on February 7, 2024 at 5:52pm
Two very expensive New Jersey Offshore wind projects, mostly supplied by European companies. . The turbines will be made in Europe, shipped by specialized European ships, elected by Europeans. New Jersey folks will be soooo lucky to get to do some of the maintenance, with mostly European replacement parts. MAKE EUROPE GREAT AGAIN . One project for 2400 MW to be completed in 2031/2032, FIRST YEAR cost $112.50/MWh, escalating at ?% for 20 years . The second project at 1342 MW, no completion date, FIRST YEAR cost $131.00/MWh, escalating at ?% for 20 years The escalations are the NJ economy killers, which nitwit Murphy and co-conspirators are perpetrating . If anyone has escalation %, please let me know
Here are some prices with no escalation . New York State had signed contracts with EU big wind companies for four offshore wind projects Sometime later, the companies were trying to coerce an additional $25.35 billion (per Wind Watch) from New York ratepayers and taxpayers over at least 20 years, because they had bid at lower prices than they should have. New York State denied the request on October 12, 2023; “a deal is a deal”, said the Commissioner . Owners want a return on investment of at least 10%/y, if bank loans for risky projects are 6.5%/y, and project cost inflation and uncertainties are high The about 3.5% is a minimum for all the years of hassles of designing, building, erecting, and paperwork of a project . The project prices, with no subsidies, would be about two times the agreed contract price, paid by Utilities to owners. . The reduction is due to US subsidies provided, per various US laws All contractors had bid too low. When they realized there would be huge losses, they asked for higher contract prices. It looks like the contract prices will need to be at least $150/MWh, for contractors to make money. Those contract prices would be at least 60% higher than in 2021 . Oersted, Denmark, Sunrise wind, contract price $110.37/MWh, contractor needs $139.99/MWh, a 27% increase Equinor, Norway, Empire 1 wind, contract price $118.38/MWh, contractor needs $159.64/MWh, a 35% increase Equinor, Norway, Empire 2 wind, contract price $107.50/MWh, contractor needs $177.84/MWh, a 66% increase Equinor, Norway, Beacon Wind, contract price $118.00/MWh, contractor needs $190.82/MWh, a 62% increase https://www.windtaskforce.org/profiles/blogs/liars-lies-exposed-as-... . NOTE: Empire Wind 2, 1260 MW, near Long- Island, was cancelled. https://www.reuters.com/business/energy/equinor-bp-cancel-contract-... . NOTE: The above prices compare with the average New England wholesale price of about 5 c/kWh, during the 2009 – 2022 period, 13 years, courtesy of: . Gas-fueled CCGT plants, with low-cost, low-CO2, very-low particulate/kWh Nuclear plants, with low-cost, near-zero CO2, zero particulate/kWh Hydro plants, with low-cost, near-zero-CO2, zero particulate/kWh
Maine Center For Public Interest Reporting – Three Part Series: A CRITICAL LOOK AT MAINE’S WIND ACT
******** IF LINKS BELOW DON'T WORK, GOOGLE THEM*********
(excerpts) From Part 1 – On Maine’s Wind Law “Once the committee passed the wind energy bill on to the full House and Senate, lawmakers there didn’t even debate it. They passed it unanimously and with no discussion. House Majority Leader Hannah Pingree, a Democrat from North Haven, says legislators probably didn’t know how many turbines would be constructed in Maine if the law’s goals were met." . – Maine Center for Public Interest Reporting, August 2010 https://www.pinetreewatchdog.org/wind-power-bandwagon-hits-bumps-in-the-road-3/From Part 2 – On Wind and Oil Yet using wind energy doesn’t lower dependence on imported foreign oil. That’s because the majority of imported oil in Maine is used for heating and transportation. And switching our dependence from foreign oil to Maine-produced electricity isn’t likely to happen very soon, says Bartlett. “Right now, people can’t switch to electric cars and heating – if they did, we’d be in trouble.” So was one of the fundamental premises of the task force false, or at least misleading?" https://www.pinetreewatchdog.org/wind-swept-task-force-set-the-rules/From Part 3 – On Wind-Required New Transmission Lines Finally, the building of enormous, high-voltage transmission lines that the regional electricity system operator says are required to move substantial amounts of wind power to markets south of Maine was never even discussed by the task force – an omission that Mills said will come to haunt the state.“If you try to put 2,500 or 3,000 megawatts in northern or eastern Maine – oh, my god, try to build the transmission!” said Mills. “It’s not just the towers, it’s the lines – that’s when I begin to think that the goal is a little farfetched.” https://www.pinetreewatchdog.org/flaws-in-bill-like-skating-with-dull-skates/
Not yet a member?
Sign up today and lend your voice and presence to the steadily rising tide that will soon sweep the scourge of useless and wretched turbines from our beloved Maine countryside. For many of us, our little pieces of paradise have been hard won. Did the carpetbaggers think they could simply steal them from us?
We have the facts on our side. We have the truth on our side. All we need now is YOU.
“First they ignore you, then they laugh at you, then they fight you, then you win.”
-- Mahatma Gandhi
"It's not whether you get knocked down: it's whether you get up." Vince Lombardi
Task Force membership is free. Please sign up today!
Hannah Pingree on the Maine expedited wind law
Hannah Pingree - Director of Maine's Office of Innovation and the Future
"Once the committee passed the wind energy bill on to the full House and Senate, lawmakers there didn’t even debate it. They passed it unanimously and with no discussion. House Majority Leader Hannah Pingree, a Democrat from North Haven, says legislators probably didn’t know how many turbines would be constructed in Maine."
 https://substack-post-media.s3.amazonaws.com/public/images/d08f3090-c0bd-4636-8663-5f958f13f44f_2119x1434.png","srcNoWatermark":null,"fullscreen":null,"imageSize":null,"height":985,"width":1456,"resizeWidth":null,"bytes":155007,"alt":"Figure 1 - Annual ROCs Issued (m) and Electricity Generated (TWh) from Ofgem Annual ROC report Figure 3.4","title":null,"type":"image/png","href":null,"belowTheFold":true,"topImage":false,"internalRedirect":null}" class="sizing-normal" alt="Figure 1 - Annual ROCs Issued (m) and Electricity Generated (TWh) from Ofgem Annual ROC report Figure 3.4" title="Figure 1 - Annual ROCs Issued (m) and Electricity Generated (TWh) from Ofgem Annual ROC report Figure 3.4" srcset="https://substackcdn.com/image/fetch/w_424,c_limit,f_auto,q_auto:good,fl_progressive:steep/https%3A%2F%2Fsubstack-post-media.s3.amazonaws.com%2Fpublic%2Fimages%2Fd08f3090-c0bd-4636-8663-5f958f13f44f_2119x1434.png 424w, https://substackcdn.com/image/fetch/w_848,c_limit,f_auto,q_auto:goo... 848w, https://substackcdn.com/image/fetch/w_1272,c_limit,f_auto,q_auto:go... 1272w, https://substackcdn.com/image/fetch/w_1456,c_limit,f_auto,q_auto:go... 1456w" sizes="100vw" loading="lazy" />
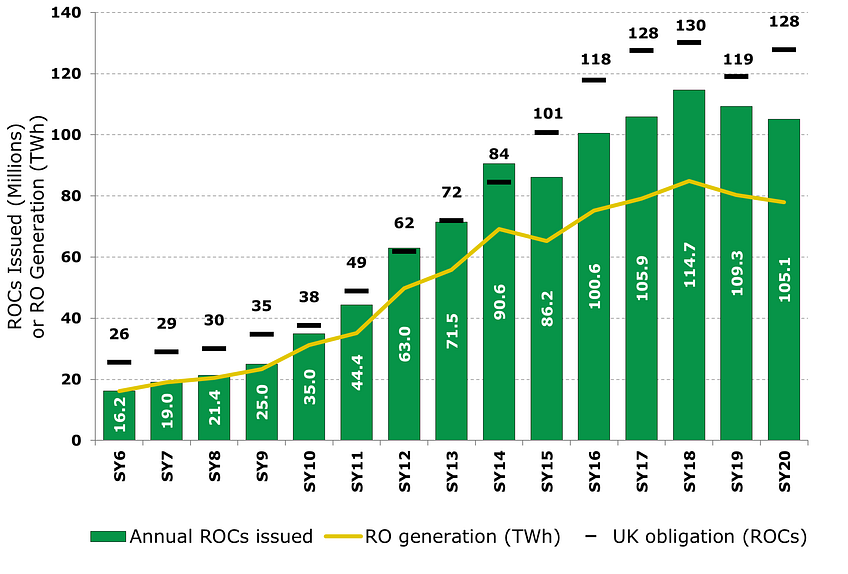
 https://substack-post-media.s3.amazonaws.com/public/images/dd9b731d-1250-4465-90da-f525ff0c799e_2477x1657.png","srcNoWatermark":null,"fullscreen":null,"imageSize":null,"height":974,"width":1456,"resizeWidth":null,"bytes":61879,"alt":"Figure 2 - Actual and Forecast ROC Scheme Value by Scheme Year (£bn)","title":null,"type":"image/png","href":null,"belowTheFold":true,"topImage":false,"internalRedirect":null}" class="sizing-normal" alt="Figure 2 - Actual and Forecast ROC Scheme Value by Scheme Year (£bn)" title="Figure 2 - Actual and Forecast ROC Scheme Value by Scheme Year (£bn)" srcset="https://substackcdn.com/image/fetch/w_424,c_limit,f_auto,q_auto:good,fl_progressive:steep/https%3A%2F%2Fsubstack-post-media.s3.amazonaws.com%2Fpublic%2Fimages%2Fdd9b731d-1250-4465-90da-f525ff0c799e_2477x1657.png 424w, https://substackcdn.com/image/fetch/w_848,c_limit,f_auto,q_auto:goo... 848w, https://substackcdn.com/image/fetch/w_1272,c_limit,f_auto,q_auto:go... 1272w, https://substackcdn.com/image/fetch/w_1456,c_limit,f_auto,q_auto:go... 1456w" sizes="100vw" loading="lazy" />
 https://substack-post-media.s3.amazonaws.com/public/images/888dbd38-ab14-41a5-9d2a-5632466ad5f7_2490x1691.png","srcNoWatermark":null,"fullscreen":null,"imageSize":null,"height":989,"width":1456,"resizeWidth":null,"bytes":58502,"alt":"Figure 3 - ROCs Issued by Technology and Scheme Year (m)","title":null,"type":"image/png","href":null,"belowTheFold":true,"topImage":false,"internalRedirect":null}" class="sizing-normal" alt="Figure 3 - ROCs Issued by Technology and Scheme Year (m)" title="Figure 3 - ROCs Issued by Technology and Scheme Year (m)" srcset="https://substackcdn.com/image/fetch/w_424,c_limit,f_auto,q_auto:good,fl_progressive:steep/https%3A%2F%2Fsubstack-post-media.s3.amazonaws.com%2Fpublic%2Fimages%2F888dbd38-ab14-41a5-9d2a-5632466ad5f7_2490x1691.png 424w, https://substackcdn.com/image/fetch/w_848,c_limit,f_auto,q_auto:goo... 848w, https://substackcdn.com/image/fetch/w_1272,c_limit,f_auto,q_auto:go... 1272w, https://substackcdn.com/image/fetch/w_1456,c_limit,f_auto,q_auto:go... 1456w" sizes="100vw" loading="lazy" />
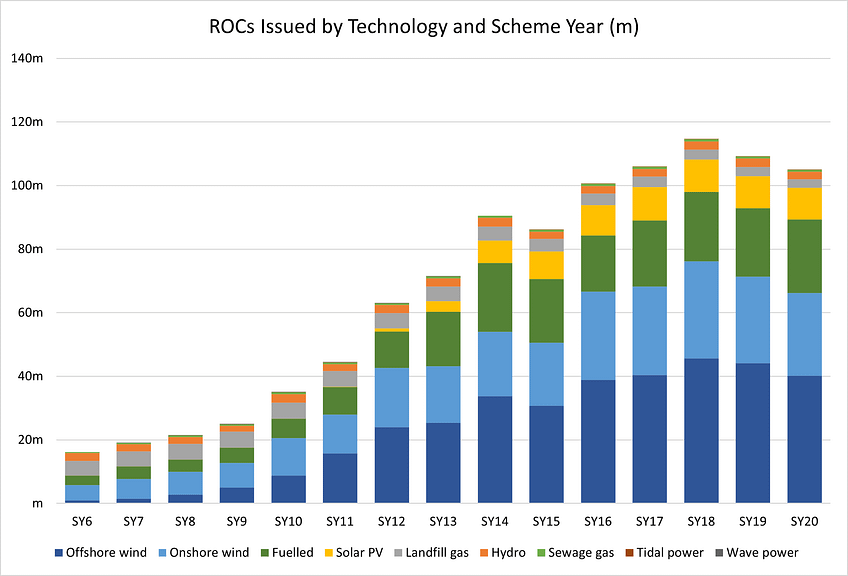
 https://substack-post-media.s3.amazonaws.com/public/images/46511580-1835-41e7-9c03-d2cdaa5b52d7_2463x1705.png","srcNoWatermark":null,"fullscreen":null,"imageSize":null,"height":1008,"width":1456,"resizeWidth":null,"bytes":61846,"alt":"Figure 4 - ROC Support (Subsidy) per MWh Generated (£ per MWh) by Year","title":null,"type":"image/png","href":null,"belowTheFold":true,"topImage":false,"internalRedirect":null}" class="sizing-normal" alt="Figure 4 - ROC Support (Subsidy) per MWh Generated (£ per MWh) by Year" title="Figure 4 - ROC Support (Subsidy) per MWh Generated (£ per MWh) by Year" srcset="https://substackcdn.com/image/fetch/w_424,c_limit,f_auto,q_auto:good,fl_progressive:steep/https%3A%2F%2Fsubstack-post-media.s3.amazonaws.com%2Fpublic%2Fimages%2F46511580-1835-41e7-9c03-d2cdaa5b52d7_2463x1705.png 424w, https://substackcdn.com/image/fetch/w_848,c_limit,f_auto,q_auto:goo... 848w, https://substackcdn.com/image/fetch/w_1272,c_limit,f_auto,q_auto:go... 1272w, https://substackcdn.com/image/fetch/w_1456,c_limit,f_auto,q_auto:go... 1456w" sizes="100vw" loading="lazy" />
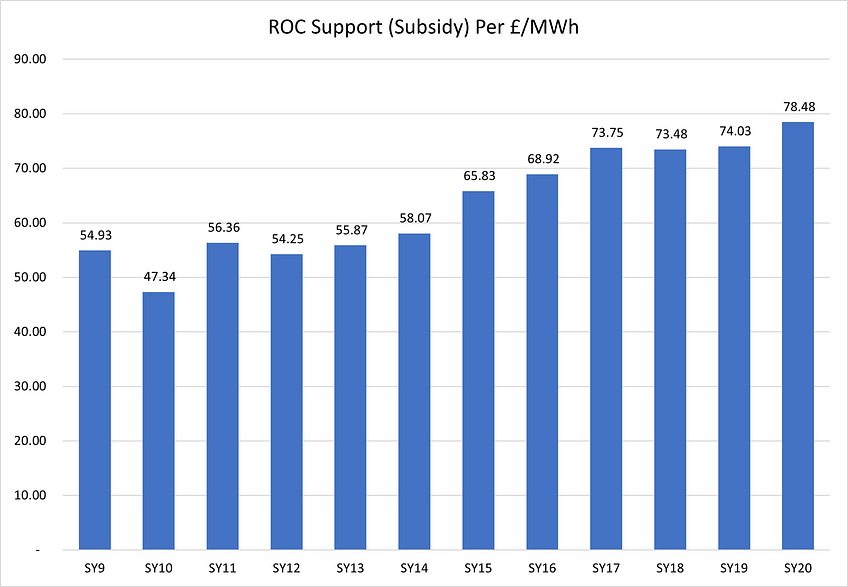
 https://substack-post-media.s3.amazonaws.com/public/images/0672650f-7119-45c4-a2da-5a5125eac264_2710x1811.png","srcNoWatermark":null,"fullscreen":null,"imageSize":null,"height":973,"width":1456,"resizeWidth":null,"bytes":49027,"alt":"Figure 5 - Subsidy by Technology SY20 (Year ended March 2022) (£ per MWh)","title":null,"type":"image/png","href":null,"belowTheFold":true,"topImage":false,"internalRedirect":null}" class="sizing-normal" alt="Figure 5 - Subsidy by Technology SY20 (Year ended March 2022) (£ per MWh)" title="Figure 5 - Subsidy by Technology SY20 (Year ended March 2022) (£ per MWh)" srcset="https://substackcdn.com/image/fetch/w_424,c_limit,f_auto,q_auto:good,fl_progressive:steep/https%3A%2F%2Fsubstack-post-media.s3.amazonaws.com%2Fpublic%2Fimages%2F0672650f-7119-45c4-a2da-5a5125eac264_2710x1811.png 424w, https://substackcdn.com/image/fetch/w_848,c_limit,f_auto,q_auto:goo... 848w, https://substackcdn.com/image/fetch/w_1272,c_limit,f_auto,q_auto:go... 1272w, https://substackcdn.com/image/fetch/w_1456,c_limit,f_auto,q_auto:go... 1456w" sizes="100vw" loading="lazy" />
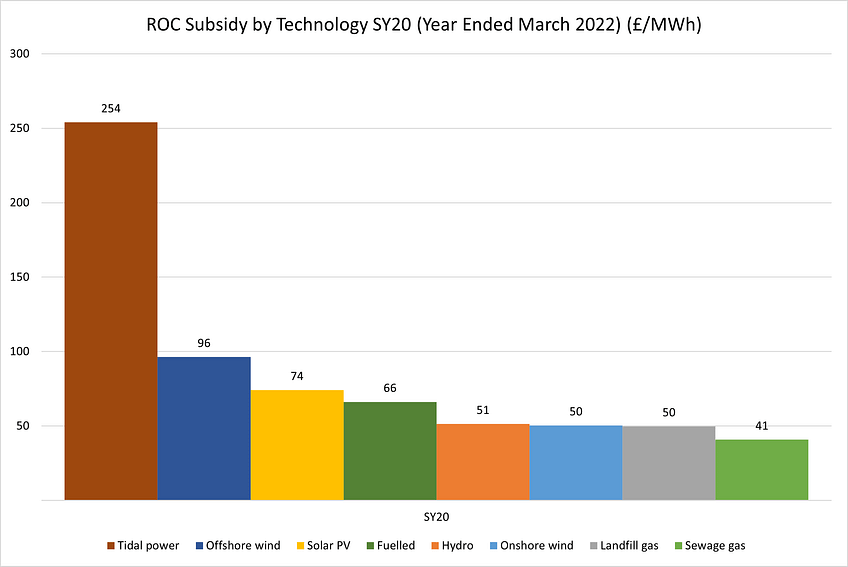
 https://substack-post-media.s3.amazonaws.com/public/images/a669d653-f02b-445a-954b-62f5fe683a07_2615x1749.png","srcNoWatermark":null,"fullscreen":null,"imageSize":null,"height":974,"width":1456,"resizeWidth":null,"bytes":65183,"alt":"Figure 6 - Top-10 Subsidy Generators in Year to end March 2023 (£m)","title":null,"type":"image/png","href":null,"belowTheFold":true,"topImage":false,"internalRedirect":null}" class="sizing-normal" alt="Figure 6 - Top-10 Subsidy Generators in Year to end March 2023 (£m)" title="Figure 6 - Top-10 Subsidy Generators in Year to end March 2023 (£m)" srcset="https://substackcdn.com/image/fetch/w_424,c_limit,f_auto,q_auto:good,fl_progressive:steep/https%3A%2F%2Fsubstack-post-media.s3.amazonaws.com%2Fpublic%2Fimages%2Fa669d653-f02b-445a-954b-62f5fe683a07_2615x1749.png 424w, https://substackcdn.com/image/fetch/w_848,c_limit,f_auto,q_auto:goo... 848w, https://substackcdn.com/image/fetch/w_1272,c_limit,f_auto,q_auto:go... 1272w, https://substackcdn.com/image/fetch/w_1456,c_limit,f_auto,q_auto:go... 1456w" sizes="100vw" loading="lazy" />
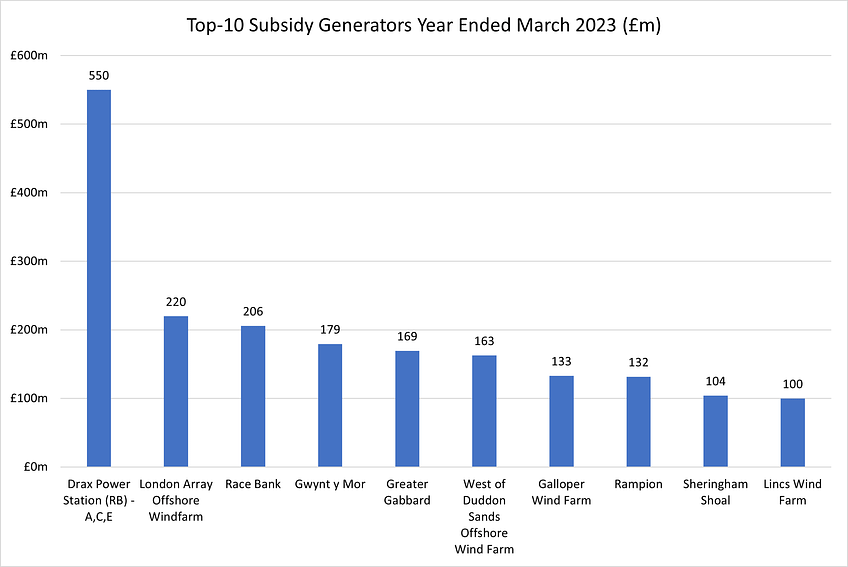
You need to be a member of Citizens' Task Force on Wind Power - Maine to add comments!
Join Citizens' Task Force on Wind Power - Maine