Big wind farms planned in far Northern Maine could benefit Mass.
A measure tucked into the state’s climate bill would allow Mass. to plug into wind energy being proposed in the northernmost reaches of Maine.
By Jon Chesto Globe Staff,Updated August 9, 2022, 5:53 p.m.
The hottest clean-energy contest currently underway in New England doesn’t involve offshore wind farms, at least not this time. Instead of the waters south of Martha’s Vineyard, this race to tap into wind energy is taking shape in the sparsely populated timberlands of Northern Maine.
And the state of Massachusetts has suddenly emerged as a key player.
Tucked in the back of the clean-energy bill the Legislature approved on July 31 and sent to Governor Charlie Baker for his signature is a provision that would allow Massachusetts to team up with Maine in bids for renewable energy projects. The focus is on an area in Aroostook County that is so remote, it’s not even technically part of New England’s electricity grid.
The language doesn’t spell out Maine or Aroostook County by name. It doesn’t have to. But it gives the Massachusetts Department of Energy Resources the green light to join with another New England state on a bid for wind, solar or other forms of renewable energy, as long as the generation sources are new and the winner is picked by the end of this year. One contest fits the bill, one that Maine officials launched earlier this year to spur clean-energy projects in Northern Maine. This dual-pronged competition would procure power from a future wind farm and/or solar farm on behalf of electricity customers, along with a parallel effort to pick a developer that could build a transmission line to bring that power into the New England grid and closer to population centers. Maine regulators are expected to pick winners this fall.
Plans for large wind farms in Aroostook County — which wraps around the northern tip of Maine along the Canadian border — have kicked around for years. The biggest stumbling block: getting that energy into the rest of New England. Maybe this contest can solve that problem.
t was set in motion by a 2021 Maine law sponsored by Senate President Troy Jackson, a fifth generation logger who represents Aroostook County. He sees it as a way of spurring much-needed economic development and infrastructure investment in his home county, while helping Maine meet its aggressive goals to reduce carbon emissions.
Earlier this year, proponents saw the potential for more buying power — which could, in turn, help finance more wind turbines — if Massachusetts ratepayers joined in. At least three interested energy companies hired lobbyists to work Beacon Hill on their behalf. Longroad Energy hired Brian Dempsey in February, while Clearway Energy Group tapped ML Strategies in April. Both Longroad and Clearway are trying to build a wind farm in Aroostook County, as is EDP Renewables. New York utility Con Edison, meanwhile, hired Preti Strategies, in April for help with its “Maine Power Link” transmission proposal; it’s the only power line developer that has gone public with its plans, though Maine Electric Power Co. and LS Power are rumored to be in the mix.
So what’s in it for Massachusetts? Much like our neighbors to the north, we have ambitious plans to reduce greenhouse gases: By 2030, state officials want to cut emissions by 70 percent from 1990 levels in the power sector alone, with an eye toward achieving an 80-percent reduction in overall carbon emissions by 2050.
These plans are off to a slow start. Six years ago, Massachusetts lawmakers voted to require utilities to hold clean-energy contests for offshore wind construction and for a gigantic power line to tap into Canadian hydropower. But federal bureaucracy repeatedly delayed the first offshore wind farm, Vineyard Wind, and on-shore construction work is only now underway. And Maine voters last fall rejected a power line that Avangrid wants to build to connect with Hydro-Quebec, in a referendum financed in large part by rival power plant owner NextEra, though that vote is being challenged in Maine’s Supreme Judicial Court.
Meanwhile, New England remains heavily reliant on natural gas. On a warm summer afternoon this week, nearly 70 percent of New England’s electricity came from natural gas power plants, with only 10 percent from hydropower, wind or other renewables.
The two Massachusetts lawmakers who led the clean-energy bill negotiations, Representative Jeff Roy and Senator Mike Barrett, are well aware of all of this. It’s a big reason why Senator Barry Finegold received a receptive audience when he proposed the provision to have Massachusetts team up with Maine as an amendment to the bill — and it’s why the measure made the final cut.
Barrett and Roy both note that the measure allows the Baker administration to join Maine in the bidding but doesn’t mandate it. It also sets certain criteria such as being cost effective for Massachusetts ratepayers, for example.
Roy said he was assured by Jackson, the top Maine lawmaker, that a power line through eastern Maine for domestic wind power, to serve Mainers, would be more widely embraced than the controversial power line that Avangrid proposed to carry Canadian hydropower through western Maine specifically for Massachusetts.
Advertisement
If the two states join forces, they could together purchase up to 1,200 megawatts of clean energy, similar to what would be pumped through Avangrid’s now-stymied line. That kind of wattage would normally power more than a million homes. But wind is intermittent, and on-shore wind farms can only be relied on for roughly one-third of that amount. So the Aroostook County projects don’t represent a perfectly even trade for the hydropower line........................
Read the full article at:
https://www.bostonglobe.com/2022/08/09/business/big-wind-farms-plan...
*************************************
Fair Use Notice: This website may reproduce or have links to copyrighted material the use of which has not been expressly authorized by the copyright owner. We make such material available, without profit, as part of our efforts to advance understanding of environmental, economic, scientific, and related issues. It is our understanding that this constitutes a "fair use" of any such copyrighted material as provided by law. If you wish to use copyrighted material from this site for purposes that go beyond "fair use," you must obtain permission from the copyright owner.
Views: 234
Comment
-
Comment by Willem Post on August 15, 2022 at 6:43am
-
DEEP-WATER FLOATING OFFSHORE WIND TURBINES IN MAINE
http://www.windtaskforce.org/profiles/blogs/deep-water-floating-off...
The Norwegians have about 60 years of experience building and servicing oil/gas rigs and laying undersea electric cables, gas lines and oil lines all over the world.
They have invested billions of dollars in specialized deep-water, Norwegian harbors and facilities for assembly of oil/gas rigs and invested in specialized sea-going heavy lifters, and specialized sea-going tugboats to tow the oil/gas rigs from Norwegian building sites to oil/gas production sites. The heavy lifters and other ships perform services all over the world.
Norway companies want to expand their business by building and servicing and providing spare parts for floating wind turbines for deep-water conditions all over the world
NOTE: Norwegians advocating expensive floating wind turbines that depend on the randomness of wind and produce high-cost, variable, intermittent electricity for other people, such as Jane and Joe Worker/Ratepayer, is highly hypocritical, because the Norwegians get 98% of their electricity from their own hydro plants, which produce low-cost, steady electricity (not variable, not intermittent). The Danes advocating wind turbines and boasting about their high percent of wind on their grid is similarly hypocritical, because the Danes have been increasingly using the storage reservoirs of Norway’s hydro plants for decades.
First Experimental Floating Wind Turbine in Norway
Equinor (formerly Statoil, a Norwegian government controlled company) launched the world's first operational deep-water, floating large-capacity wind turbine in 2009. The turbine trade name is “Hywind”.
The wind turbine consists of a 120 m (390 ft) tall tower, above the sea water level, and a 60 m (195 ft) submerged extension below the sea water level, with a heavy weight at the bottom to keep the wind turbine steady and upright, even with very high waves and strong wind conditions. The design was tested and perfected under storm and wind conditions simulated in a laboratory.
The 2.3 MW wind turbine is mounted on top of the tower. It was fully assembled in a deep-water harbor near Stavanger, Norway.
It was towed to a site 10 km (6.2 mi) offshore into the Amoy Fjord in 220 m (720 ft) deep water, near Stavanger, Norway, on 9 June 2009, for a two-year test run, which turned out to be successful.
First Commercial Floating Wind Turbine Plant in Scotland
Hywind Scotland project is the world's first commercial wind turbine plant using floating wind turbines.
It is located 29 km (EIGHTEEN MILES) off Peterhead, Scotland to minimize visual impacts from shore.
It has five Hywind floating turbines with a total capacity of 30 MW.
It is operated by Hywind (Scotland) Limited, a joint venture of Equinor, Norway (75%) and Masdar, Kuwait (25%).
In 2015, Equinor received permission to install 5 Hywind turbines in Scotland.
Manufacturing started in 2016 in Spain (wind turbine, rotor), Norway (tower, underwater base, assembly), and Scotland (various parts)
The turnkey capital cost was $263 million for five 6 MW turbines, or $8,767/kW.
They were designed to float on the surface, with about 180 m (600 ft) above the sea water level and 80 m (265 ft) submerged below the seawater level.
Total steel weight is about 2300 metric ton, total ballasted weight is about 20,000 metric ton.
Heavy weights in the bottom of the submerged parts serve to keep them steady and upright.
The turbines were assembled at Stord in Norway in the summer of 2017, using the specialized Saipem 7000 floating crane, and then towed to the north of Scotland by sea-going tugboats.
Make sure to see the videos showing the crane assembling the entire wind turbine.
Nothing like that exists in Maine, or in the rest of New England.
That means offshore wind turbine assembly and servicing would largely be performed by foreign companies, which already have built the infrastructures and other facilities during the past 25 years.
https://www.youtube.com/watch?v=PUlfvXaISvc
https://www.youtube.com/watch?v=PmkA6hbJ_j8
https://www.youtube.com/watch?v=bQVU7UaMuck
The huge, sea-going, specialized, crane (14,000-metric ton lifting capacity) is required for partial assembly on land and final assembly in an area close to shore with a very deep harbor, before towing, fully assembled, to the site.
The finished turbines were towed to Peterhead, Scotland.
Three cup anchors hold each turbine in place.
About 2400 meter of chain is required, weighing 400 metric ton, for each turbine.
The Hywind Scotland project was commissioned in October 2017.
Hywind Wind Turbines for Demonstration Purposes in Maine
Hannah Pingree and other Maine's wind bureaucrats in state government are engaging in mindless prattle, eager to do the bidding of various multi-millionaires and foreign companies that may be providing some wining/dining boondoggle trips to “view the Hywind turbines” in Norway and Scotland.
The turnkey cost of those two Hywind turbines would be about $10,000 per kW, versus NE ridgeline wind at $2,000/kW, and regular offshore, south of Martha’s Vineyard, at $4,000/kW.
http://www.windtaskforce.org/profiles/blogs/iso-ne-study-of-1600-mw...
That would be at about $120 million for a two 6 MW Hywind wind turbines, plus whatever facilities would need to be built in Maine to support the project.
The turnkey capital cost of the wind turbine plant in Maine would be much higher, because Maine does not have the experience of the Norwegians and the specialized equipment and specialized ships, and other facilities. It would be very costly to build those facilities and ships in Maine, or elsewhere.
600-ft Tall Hywind Turbines Highly Visible From Mohegan Island, Plus Infrasound
The 600-ft tall Hywind wind turbines would be highly visible from Mohegan Island, if they were located TWO MILES east of the island.
At that distance, the problem would not be just cyclical, audible noises keeping people awake, but also low frequency infrasound, which can travel many miles, and passes through walls of houses, and can be felt but not heard, and has been shown to have adverse health impacts on people and animals.
http://www.windtaskforce.org/profiles/blogs/wind-turbine-noise-adve...
The FAA-required aviation beacons would be clearly visible during nighttime. BTW, they would need to be located about 15 - 20 miles away from Mohegan Island to be unobtrusive to the Islanders.
Here is a research report of daytime and nighttime visibility of wind turbines that are about 3 to 4 MW and about 500 ft tall. See URL with photos.
http://visualimpact.anl.gov/offshorevitd/docs/OffshoreVITD.pdf
“Study objectives included identifying the maximum distances the facilities could be seen in both daytime and nighttime views and assessing the effect of distance on visual contrasts associated with the facilities. Results showed that small to moderately sized facilities were visible to the unaided eye at distances greater than 42 km [26 miles (mi)], with turbine blade movement visible up to 39 km (24 mi). At night, aerial hazard navigation lighting was visible at distances greater than 39 km (24 mi). The observed wind facilities were judged to be a major focus of visual attention at distances up to 16 km (10 mi), were noticeable to casual observers at distances of almost 29 km (18 mi), and were visible with extended or concentrated viewing at distances beyond 40 km (25 mi).”
One has to feel sorry for all the residents of Mohegan Island, but the bureaucrats in Augusta, Maine, do not care about that, because there are not enough votes to stop them. Those bureaucrats are hell-bent to use federal and state grants, subsidies, taxpayer and ratepayer money of already-struggling Joe and Jane Worker to save the world, and to enrich a host of multi-millionaires seeking tax shelters. See Appendix.
Some Questions
Who are these Aqua Ventus multi-millionaire owners pushing for this expensive project?
How much would be the subsidies?
What would be the energy cost/kWh?
How long would the project last before it would have to be repaired?
How would it be repaired?
Would any special ships, facilities be required?
Does Maine have the required, at least 100-meter, deep-water port?
Is anyone looking at the entire picture on an A to Z basis, or are Maine bureaucrats just dreaming/prattling about castles in Spain?
Does anyone think the Norwegians would not want to make money to maintain/service and provide spare parts for their Hywind wind turbines?
Extremely Adverse Impact on CMP Electric Rates
LePage’s energy director, Steven McGrath, has focused exclusively on the cost of electricity from the demonstration project.
The rate is at least FOUR TIMES above wholesale market value, reflecting the custom design and experimental nature of the platforms.
It would start at 23 cents per kilowatt-hour in the first year, escalating at 2.5% per year to 35 cents after 20 years.
The PUC estimates it would add up to $208 million over the term, or about $10.5 million a year from Central Maine Power ratepayers. Maine Aqua Ventus had calculated the extra cost would add 73 cents a month to the average household electric bill, in the first year of operation, more thereafter.
That is a total rip-off, because Massachusetts pays only an average of 8 - 9 c/kWh over the life of the project.
Main bureaucrats need to learn from Governor Baker.
NOTE: The above prices should be compared with NE wholesale prices, which have been about 5 c/kWh since 2008, courtesy of abundant, domestic, low-cost, low-CO2 electricity from gas at about 5 c/kWh, and low-cost, near CO2-free electricity from nuclear at about 4.5 - 5.0 c/kWh.
This project is insanity on STEROIDS.
One has to feel sorry for the already-struggling Joe and Jane Workers in Maine who will ultimately pay for all this.
https://www.pressherald.com/2018/04/01/effort-to-build-offshore-win...
NOTE:
Dear Mr. Greg Kesich, Editor Portland Press Herald
(Mr. Greg suggested I write an op-ed regarding the referenced PPH article, so here it is.)
This op-ed is in reference to an article on floating wind turbines off the coast of Maine in the Portland Press Herald, dated 20 May 2019.
https://www.pressherald.com/2019/05/20/our-view-blown-off-course-ma...
The article states, Statoil had proposed a $120 million demonstration project for two 6 MW Hywind turbines ($10,000/kW) off Boothbay Harbor, but that Governor Page had rejected it. As you recall, his main reason was the higher electricity prices Joe and Jane Worker/Ratepayer would have to pay for 20 years.
The article states, Statoil instead took its project to Scotland, where it has invested more than $200 million for five 6 MW Hywind turbines. After some checking, the actual turnkey cost turned out to be $263 million.
Scotland got the turbines at $8,767/kW in 2017, but Maine would have gotten the same turbines at $10,000/kW.
The article states, “.....and given that country (Scotland) a head start on establishing itself as developer, manufacturer and exporter of offshore technology. Such potential was recognized by the wind energy task force, which was created in 2008 by Gov. John Baldacci and released its findings in December 2009.”
That statement is highly naïve and unrealistic. Norway has invested billions of dollars in infrastructures to develop specialized facilities and seagoing ships for shallow-water and deep-water wind turbines during the past 10 - 15 years. Norway has absolutely no intention of establishing Scotland and Maine as competitors.
The Scotland/UK actual contributions to the project were:
1) Scotland making some parts that were shipped to Norway for assembly
2) Scotland providing the site 18 miles from shore to minimize visual impacts from shore.
3) The UK providing a subsidy of 18.5 c/kWh, plus Statoil selling electricity at about 6.5 c/kWh on the wholesale market, for a total wholesale cost of 25 c/kWh for 20 years. This compares with New England wholesale prices averaging about 5 c/kWh since 2008.
4) The Scotland people paying higher prices/kWh for low-value, variable/intermittent electricity for 20 years that requires the services of other generators for peaking, filling in and balancing year-round. Statoil had to provide a 1.0 MWh li-ion battery system, at a capital cost of about $700,000, to help smooth the flow of the variable electricity from Hywind to minimize disturbances of the Scotland grid.
NOTE: If Maine government would have insisted Statoil would build significant infrastructure in Portland, ME, or elsewhere in Maine, Statoil, if willing to do so, would merely have increased the cost of the electricity, c/kWh, to cover its additional costs.
NOTE: Massachusetts has signed contracts for 800 MW of offshore wind turbines south of Martha’s Vineyard. If the state government would have insisted the consortium of European companies would build significant infrastructure in New Bedford, MA, or elsewhere in Massachusetts, the consortium, if willing to do so, would merely have increased the cost of the electricity, c/kWh, to cover its additional costs. However, Governor Baker insisted on lowest electricity cost, as that would benefit all of Massachusetts, not just New Bedford, etc. Counting votes is important. See URL.
http://www.windtaskforce.org/profiles/blogs/iso-ne-study-of-1600-mw...
NOTE:
School Students Playing with Floating Wind Turbines
The main objective with floating wind turbines is to isolate the wind turbine from any wave action, including 30 - 40 ft waves. That can only be done with a long, submerged extension of the wind turbine mast, with a heavy weight inside the bottom of the extension (ballast) to keep the wind turbine steady and upright.
Dr. Habib Dagher, Executive Director of the Advanced Structures & Composites Center, should have watched the youtube video, and then given proper instructions to teachers all over Maine, so those teachers could have educated these students regarding the physical requirements, to ensure these students would not waste their valuable time and money building inappropriate models. See URLs and watch both videos.
https://www.youtube.com/watch?v=PmkA6hbJ_j8
https://www.wabi.tv/content/news/Students-compete-to-build-most-sta...
-
-
There are no benefits from wind systems, never call them farms, other than much higher costs of electricity, c/kWh, as is the case in Europe, which is in despair trying to restart coal plants, nuclear plants, and Brussels calling nuclear and natural gas renewable.
The Rhine having extremely low water, and all of Europe having high inflation, all because they went hog wild for wind and solar forgetting the wind has to blow and the sun has to shine to get ANY electricity.
Brussels idiot bureaucrats, pushed by German eco-fiends, finally are waking up to a VERY GRIM reality, MEANING YOU CANNOT LEAVE IT MEANING FOSSIL FUELS, IN THE GROUND.
FOSILL FUELS ARE THE GREATEST BENEFIT TO MANKIND, EVER
THEY ENABLE OUR LIFESTYLES AND SUPORT 8 BILLION PEOPLE WITH FOOD
-
-
COST SHIFTING IS THE NAME OF THE GAME REGARDING WIND AND SOLAR
http://www.windtaskforce.org/profiles/blogs/cost-shifting-is-the-na...
Regarding wind and solar, cost shifting is rarely mentioned, identified or quantified. Those costs, as c/kWh, could be quantified, but it is politically expedient, using various, often far-fetched reasons, to charge them to:
- Directly to ratepayers, via electric rate schedules, and/or added taxes, fees and surcharges on electric bills
- Directly to taxpayers, such as carbon taxes, user fees and surcharges.
- Directly to federal and state budgets and debts
Per Economics 101, no cost ever disappears.
Eventually, the various shifted wind and solar costs, plus direct and indirect wind and solar subsidies, would increase the prices of energy and of other goods and services.
Efficiency and productivity improvements elsewhere in the energy sector, and other sectors of the economy, may partially, or completely, offset such increases.
However, wind and solar subsidies would divert capital from other sectors of the economy, which likely would result in fewer improvements in efficiency and productivity in these sectors.
http://www.windtaskforce.org/profiles/blogs/high-demand-and-low-win...
LIFECYCLE COST ANALYSIS OF EXISTING AND NE ELECTRICITY SOURCES
This report uses publicly available data to estimate the average levelized cost of electricity from existing generation resources (LCOE-Existing), as compared to the levelized cost of electricity from new generation resources (LCOE-New) that might replace them.
The additional information provided by LCOE-Existing presents a more complete picture of the generation choices available to the electric utility industry, policymakers, regulators and consumers.
https://www.instituteforenergyresearch.org/wp-content/uploads/2019/...
Existing coal-fired power plants can generate electricity at an average LCOE of $41 per megawatt-hour, whereas the LCOE of a new coal plant, operating at a similar duty cycle, would be $71 per MWh.
Similarly, existing combined-cycle gas power plants (CCGTs) can generate electricity at an average LCOE of $36 per MWh, whereas the LCOE of a new CCGT gas plant would be $50 per MWh.
Non-dispatchable wind and solar impose a cost on the dispatchable generators which are required to remain in service for peaking, filling in and balancing, 24/7/365, to ensure reliable electricity service.
Non-dispatchable means the output of wind and solar depends on factors beyond our control (the wind blowing and the sun shining) and cannot be relied upon for peaking, filling in and balancing.
Wind and solar increase the LCOE of dispatchable resources by reducing their utilization rates without reducing their fixed costs, resulting in a levelized fixed cost increase, i.e., higher c/kWh.
This report estimates the “imposed cost” of wind generation at about $24 per MWh, or 2.4 c/kWh, if CCGT gas generation performs the peaking, filling in and balancing.
The CCGT plants compensate for the erratic outputs of wind and solar by inefficiently ramping up and down their outputs at part load, and inefficiently making more frequent starts and stops.
All that decreases annual production of CCGT plants, adversely affects their economic viability, increases Btu/kWh and CO2/kWh, and increases wear and tear, all at no cost to the wind and solar multi-millionaires.
This report estimates the “imposed cost” of wind generation at about $24 per MWh, or 2.4 c/kWh, if CCGT gas generation performs the peaking, filling in and balancing.
This report estimates the “imposed cost” of solar generation at about $21 per MWh, or 2.1 c/kWh, if CCGT gas generation performs the peaking, filling in and balancing.
As a result, existing coal ($41), CCGT gas ($36), nuclear ($33) and hydro ($38) are less than half the cost of new wind ($90) or new PV solar ($88.7), if imposed costs were included.
NOTE: The imposed cost on ratepayers and taxpayers of various direct and indirect wind and solar subsidies are an entirely separate issue.
COST SHIFTING ONTO RATEPAYERS, TAXPAYERS AND DEBT
Clever multi-millionaires have known about wind and solar being much more expensive compared with existing generation (coal, oil, gas, nuclear, hydro, etc.) for at least 25 years.
https://www.instituteforenergyresearch.org/wp-content/uploads/2019/...
By beating the drums of climate change and global warming, and using clever lobbyists in the halls of Congress and State legislatures, they were able to get all sorts of goodies, such as upfront cash grants, upfront tax credits, low-cost loans, generous, above-market, feed-in tariffs, production tax credits, and loan interest and asset depreciation write-offs to avoid paying income taxes.
All that enables them, and others to claim wind and solar is equivalent and competitive with other workers. What more could these millionaires ask for?
Cost Shifting: Here is a partial list of the costs that were shifted, i.e., not charged to wind and solar plant owners, to make wind and solar appear less costly than in reality to the lay public and legislators.
1) The various forms of grid-stabilizing inertia (presently provided by synchronous gas, coal, oil, nuclear, bio and hydro plants).
2) The filling-in, peaking and balancing by traditional generators (mostly gas turbines in New England), due to wind and solar variability and intermittency, 24/7/365. Their random outputs require the other generators to inefficiently ramp up and down their outputs at part load, and to inefficiently make more frequent starts and stops, which also causes more wear and tear, all at no cost to wind and solar owners.
The more wind and solar on the grid, the larger the required up and down ramping of the gas turbines, which imparts added costs to owners for which they likely would not be paid: And the wind and solar erratic output is coddled by government programs and subsidies!!
Owners of traditional generators:
- Have less annual production to cover power plant costs, which jeopardizes the economic viability of their plants.
- Are left with inefficient remaining production (more fuel/kWh, more CO2/kWh), due to up and down ramping at part load, and due to more frequent starts and stops, which leads to less fuel and CO2 reduction than claimed, and increased costs for owners. See URL
http://www.windtaskforce.org/profiles/blogs/fuel-and-co2-reductions...
- Have more wear and tear of their gas turbine plants, which further adds to owner costs
NOTE: All of this is quite similar to a car efficiently operating at a steady 55 mph, versus a car inefficiently operating at continuously varying speeds between 45 mph to 65 mph, and accelerating for frequent starts and decelerating for frequent stops.
3) Any battery systems to stabilize distribution grid with many solar systems. They would quickly offset downward spikes due to variable cloud cover. See URL.
http://www.windtaskforce.org/profiles/blogs/large-scale-solar-plant...
4) Any measures to deal with DUCK curves, such as a) daily gas turbine plant down and up ramping, b) utility-scale storage and c) demand management.
NOTE: GMP in Vermont, has determined 70 of its 150 substations will eventually need upgrades to avoid “transmission ground fault overvoltage,” (TGFOV), if more solar is added per requirements of the VT Comprehensive Energy Plan. This is nothing new, as utilities in southern Germany have been dealing with these issues for over ten years, which has contributed to German households having the highest electric rates (about 30 eurocent/kWh) in Europe.
5) Grid-related costs, such as grid extensions and augmentations to connect the remotely distributed wind and solar, and to deal with variable and intermittent wind and solar on the grid. Those grid items usually are utilized at the low capacity factors of wind and solar, i.e., a lot of hardware doing little work.
6) Utility-scale electricity storage (presently provided by the world’s traditional fuel supply system).
https://www.neon-energie.de/Hirth-2013-Market-Value-Renewables-Sola...
The above 6 items are entirely separate from the high levels of direct and indirectsubsidies. They serve to make wind and solar appear to be much less costly than in reality. See sections 1 and 2 and Appendix.
All that enables wind and solar proponents to endlessly proclaim: “Wind and solar are competitive with fossil and nuclear”.
Example of Cost Shifting: For example, to bring wind electricity from the Panhandle in west Texas to population centers in east Texas, about 1000 miles of transmission was built at a capital cost of $7 billion. The entire cost was “socialized”, i.e., it appeared as a surcharge on residential electric bills. Wind in Texas would have been much more expensive, if the owning and operating cost, c/kWh, of those transmission lines were added to the cost of wind.
Example of Cost Shifting: Often the expensive grid connection of offshore wind plants, say from 20 miles south of Martha's Vineyard, across the island, then about 7 additional miles under water, and then to the reinforced mainland grid, is not separately stated in the capital cost estimates, i.e., all or part of it is provided by the utilities that buy the electricity under PPAs to make PPA-pricing appear smaller than in reality. That cost would be “socialized”, i.e., it appears as a surcharge on residential electric bills, or is added to the rate base.
Wind and Solar Wholesale Prices in NE: Here are some wholesale prices of wind electricity RE folks in New England, especially in Maine, do not want to talk about. They would rather dream RE fantasies, obfuscate/fudge the numbers, and aim to convert others to their dream scenarios, somewhat like religious missionaries.
EXHORBITANT REAL COST OF WIND AND SOLAR ELECTRICITY
“All-in” Electricity Cost of Wind and Solar in New England
https://www.windtaskforce.org/profiles/blogs/high-costs-of-wind-sol...
http://www.windtaskforce.org/profiles/blogs/cost-shifting-is-the-na...
Pro RE folks point to the “price paid to owner” as the cost of wind and solar, purposely ignoring the other cost categories. The all-in cost of wind and solar, c/kWh, includes:
1) Above-market-price paid to Owners
2) Subsidies paid to Owners
3) Owner return on invested capital at about 9%/y
4) Grid extension/augmentation
5) Grid support services
6) Future battery systems
Comments on table 1
- Vermont legacy Standard Offer solar systems had greater subsidies paid to owner, than newer systems
- Wind prices paid to owner did not have the drastic reductions as solar prices.
- Vermont utilities are paid about 3.5 c/kWh for various costs they incur regarding net-metered solar systems
- "Added to rate base" is the cost wind and solar are added to the utility rate base, used to set electric rates.
- “Total cost”, including subsidies to owner and grid support, is the cost at which wind/solar are added to the utility rate base
- “NE utility cost” is the annual average cost of purchased electricity, about 6 c/kWh, plus NE grid operator charges, about 1.6 c/kWh
for a total of 7.6 c/kWh.
- “Grid support costs” would increase with increased use of battery systems to counteract the variability and intermittency of increased build-outs of wind and solar systems. See URL
https://www.windtaskforce.org/profiles/blogs/fuel-and-co2-reduction...
NOTE: NE wholesale grid price averaged about 5 c/kWh, starting in 2009, due to low-cost CCGT and nuclear plants providing at least 65% of all electricity loaded onto the NE grid, in 2019.
https://www.iso-ne.com/about/key-stats/resource-mix/
https://nepool.com/uploads/NPC_20200305_Composite4.pdf
NOTE: There are Owning costs, and Operating and Maintenance costs, of the NE gridISO-NE charges these costs to utilities at about 1.6 c/kWh. The ISO-NE charges include:
Regional network services, RNS, based on the utility peak demand occurring during a monthForward capacity market, FCM, based on the utility peak demand occurring during a year.
NOTE: These prices are of several years ago. Current prices are much higher, due to
1) Increased inflation rates,
2) Increased interest rates,
3) Supply chain disruptions,
4) Increased energy prices, such as of oil, gas, coal, etc.,
5) Increased materials prices, such as of Tungsten, Cobalt, Lithium, Copper, etc. See URLs
https://cms.zerohedge.com/s3/files/inline-images/2022-03-21_15-28-4...
https://www.zerohedge.com/commodities/tesla-hikes-megapack-prices-c...
Table 1/VT & NE sources
Paid to
Subsidy
Grid
GMP
Added
ISO-NE
Total
NE
Times
paid to
support
to rate
RNS+
utility
owner
towner
cost
adder
base
FCM
cost
cost
c/kWh
c/kWh
c/kWh
c/kWh
c/kWh
c/kWh
c/kWh
c/kWh
Solar, rooftop, net-metered, new
17.4
5.2
2.1
3.5
20.9
1.6
29.8
7.6
3.92
Solar, rooftop, net-metered, legacy
18.2
5.4
2.1
3.5
21.7
1.6
30.8
7.6
4.05
Solar, standard offer, combo
11.0
6.74
2.1
11.0
1.6
21.44
7.6
2.82
Solar, standard offer, legacy
21.7
10.5
2.1
21.7
1.6
35.9
7.6
4.72
Wind, ridge line, new
8.5
3.9
2.4
8.5
1.6
16.4
7.6
2.15
Wind, offshore, new
9.0
4.1
2.4
9.0
1.6
17.1
7.6
2.25
Sample calculations:
NE utility cost = 6, Purchased + 1.6, (RNS + FCM) = 7.6 c/kWh
Added to utility rate base = 17.4, net-metered, new + 3.5 = 20.9 c/kWh
Total cost = 17.4 + 5.2 + 2.1 + 3.5 + 1.6 = 29.8 c/kWh
Excludes costs for very expensive battery systems
Excludes costs for very expensive floating, offshore wind systems
Excludes cost for dealing with shortfalls during multi-day wind/solar lulls. See URL
https://www.windtaskforce.org/profiles/blogs/wind-and-solar-provide...
“Added to rate base” is for recent 20-y electricity supply contracts awarded by competitive bidding in NE.
“Added to rate base” would be much higher without subsidies and cost shifting.
Areas with better wind and solar conditions, and lower construction costs/MW have lower c/MWh, than NE
New England has average winds, has highest on-shore turnkey costs ($2,400/kW in 2020), has highest PPA c/kWh
See page 39 of URL
https://www.energy.gov/sites/default/files/2021-08/Land-Based%20Win...
-
Comment by Dan McKay on August 10, 2022 at 8:01pm
-
Actually, The PUC has said HVDC line proposals can bid into this RFP
-
-
McKay,
HVDC lines have very low losses over very long distances
They are widely used in Europe
-
-
The most uneconomical method of transferring energy is by moving it long distances as line losses extremely reduce the energy upon arrival.
The most uneconomical method of moving weather corrupted energy is by keeping it within an area where electrical demand is relatively small like Aroostook County.
Not only will this solar/wind energy overwhelm The County on weather rich days subjecting its distribution lines and substations to rapid overloading, but, on weather-poor days, a reversal of opportunity will mean somewhere to the south, sleeping generation will need to ramp up to compensate for the lull in home-made, dinosaur energy.
It's one thing to corrupt a population with promises of riches, it's another thing to physically and economically corrupt an energy delivery system.
Any and all parts of this proposal must be value tested to the 2020 price of wholesale electricity of the ISO-NE and NMISA markets, about a third of 2022 prices. Any price above 2020 wholesale prices must be rejected by the PUC, whether the purchaser is a Maine utility or an out of state utility.
Any transmission line proposal large enough to transfer energy out of Aroostook County must be rejected even if it costs Maine just one red cent.
-
Comment by Art Brigades on August 10, 2022 at 2:19pm
-
Maine did a decent job - despite the red carpet Expedited Wind Law - of minimizing the Wind Rush. Only 1000 MW of the 2700 MW statutory goal. But the wind bastards are finally getting their way. Clearway Energy has a huge project planned just east of Baxter State Park. Their attorney is Tony Buxton of Preti Flaherty. He has long been an anti-wind advocate in Augusta. But he, like infamous bank robber Willie Sutton, is now going "where the money is."
Preti Strategies (a subsidiary of Mr. Buxton's firm) has been retained by ConEdison to promote this con job. Troy Jackson's son, Chace Jackson, had been until recently an employee of Preti. Chace is now employed as External Affairs Manager at Summit Utilities, which is run by former PUC Chair, Baldacci lawyer, and First Wind exec Kurt Adams. Summit also employs Executive VP Angus King III.
Maine is screwed.
-
Comment by Long Islander on August 10, 2022 at 12:49pm
-
If anyone is interested, wind project easements can be seen at the southern Aroostook Registry of Deeds.
https://www.aroostookdeedsouth.com/RegistrySearch/
You may be required to register which takes a minute and is free.
HINT: Search for ALL document types and do not specify a date range. You may wish to search for a particular Party. But I suggest you try searching for a Party named HIGH VALE.
Click on VIEW and once you are looking at the document, be sure to use the forward arrow to go to the next page(s).
Some of these may be expired. It is interesting though in that their locations, plotted on a map, show you what they were/are thinking in terms of siting their wind projects.
You may also wish to search the Northern Aroostook Registry of Deeds:
https://www.aroostookdeednorth.com/RegistrySearch/
as well as the Penobscot Registry of Deeds.
https://penobscotdeeds.com/ALIS/WW400R.HTM?WSIQTP=LR01D&WSKYCD=N
Two names come up as associated with High Vale:
Susan Jones (Sue Jones)
Andrew T. Goode
Both at the same address in Freeport, ME.
-
-
This article shows the wind/solar generation shortfall, due to a one-day wind/solar lull
It also shows the electricity drawn from the high-voltage grid to enable grid-scale battery systems to counteract the shortfall
https://www.windtaskforce.org/profiles/blogs/grid-scale-battery-sys...
New England power plants, all sources, plus imports from nearby grids, load about 125 billion kWh/y onto the NE grid.
Transmission loss is about 2.5%; to distribution grids 121.875 billion kWh/y
Distribution loss is about 6.5%; to user electricity meters 113.953 billion kWh/y
Grid-scale battery systems typically are connected to the NE high-voltage grid by step-down and step-up transformers. The below calculations show the electricity drawn from the high voltage grid to charge the battery system, and then discharge the battery system to counteract a one-day wind/solar lull. We make the following assumptions:
1) Greatly increased wind and solar connected to the NE grid at some future date, such as: wind onshore at 12.5%, wind offshore at 12.5%, and solar at 25% of grid load, on an annual basis, which would provide about 50% of the annual grid load, or 125/2 = 62.5 TWh/y, or 0.171 TWh/d
2) Wind/solar generation at 15% of normal during a wind/solar lull lasting 24 hours
Wind/solar loaded onto the NE grid would be 0.15 x 0.171 = 0.02568 TWh/d
Shortfall would be 0.171 – 0.02568 = 0.14555 TWh/d
3) Grid-scale battery systems, connected to the HV gird, provide the shortfall, in TWh/d
Fed to HV grid via step-up transformer 0.14555, as AC, to make up shortfall
Step-up transformer loss at 1%.
From battery system as AC to step-up transformer 0.14700
Back-end power electronics loss at 3.5%
Fed from battery to back-end power electronics 0.15215, as DC
Battery discharge loss at 4%
Deduction from battery charge 0.15823, as DC
Battery charge loss at 4%
Fed to battery 0.16456, as DC
Front-end power electronics loss at 3.5%
Fed to front-end power electronics 0.17032, as AC
Step-down transformer loss at 1%
Drawn from HV grid via step-down transformer 0.17203, as AC
Battery System Losses
About 0.17203/0.14555 x 100% = 18.2% more needs to be drawn from the HV grid to charge the battery systems up to about 80% full (preferably many days before any wind/solar lull starts), than is fed to the HV grid by discharge from the battery system to about 20% full; the loss percentage increases with aging.
Battery systems are rated at a level of power, MW, provided for a number of hours, MWh, such as 2 MW/8 MWh, as AC at battery voltage, which needs to be stepped up to HV voltage.
Peak Grid Loads on the NE Grid During Wind/Solar Lulls
Electricity loaded onto HV grids, such as by power plants, and electricity drawn from HV grids, such as by utilities, are monitored/recorded by ISO-NE
User electricity consumption is monitored by utilities for billing purposes
Peak grid load on the NE grid occurs when the highest amount of electricity is consumed in a single hour.
ISO-NE, the grid operator, must ensure NE has sufficient power resources to provide the peak load.
The below chart shows the days with the highest loads, MW, on the NE grid, ever since ISO-NE began managing the grid in 1997.
https://www.iso-ne.com/about/key-stats/electricity-use/
Peak loads on winter days are about 5000 MW less than on summer days
Peak loads on winter weekends are about 3000 MW less than on summer weekends
Summer peak loads occur during late-afternoon/early-evening, when solar output, MW, has become minimal, and winds typically are minimal, according the ISO-NE minute-by-minute operating data.
That means, the wind/solar MW loaded onto the NE grid is almost always minimal during peak demand hours.
That means almost the entire peak load has to be provided by other sources, such as by:
1) Any remaining traditional plants, such as oil, gas, dual-fuel oil/gas, coal, and nuclear plants.
The gas/oil plants likely would be highly efficient, up to 60%, combined-cycle, gas-turbine plants, CCGTs
2) Tree burning plants, mostly in Maine, at an efficiency of 25%, i.e., the energy equivalent of 3 out of 4 trees is wasted
3) NE hydro plants, most about 80 to 100 years old. Almost all of them are run-of-river plants with high outputs in Spring and low outputs in Summer and early-Fall
4) Minor miscellaneous NE sources, such as farm methane.
5) Imported from nearby grids. The CO2 of imported electricity is charged to the jurisdiction of origin, i.e., not to New England, per EPA and UN standards. See Note
These five sources would provide 50% of the annual load onto the NE grid, with wind/solar providing the other 50%, at some future date.
However, averages are deceptive.
These five sources, during a summer peak load of 27,500 MW (see image), with an almost-daily wind/solar lull during late-afternoon/early-evening, would provide electricity at a rate of 27,500 MW x 8766 h/y x 0.75 capacity factor (assumed) = 181 TWh/y, which would be 181/125 = 1.45 times greater than the average load onto the NE grid.
The daily average loading rate is at 125/365 = 0.3425 TWh/d
The peak loading rate is at 181/365 = 0.4990TWh/d
These five sources would need to have a "nameplate rating" of about 32,000 MW connected to the NE grid (which includes reserves), plus imports, to load 27,500 MW onto the NE grid, because many plants do not operate at "nameplate rating", even during peak demand hours, which is especially the case with wind and solar. See Note.
NOTE: The imported electricity may not be available to New England, because it may be needed by nearby grids, as California found out during a major US Southwest heat wave, when nearby states sent no electricity to California. This scenario could happen in NE.
NOTE: Political decisions by “leave-it-in-the-ground" people led to politicians forcing the closing of some of the traditional oil, gas, and nuclear plants.
However, these plants, and their energy supplies, are needed every day, as the misled German people are finding out much to their physical and financial discomfort.
Additional hot water and gas supply curtailments, and extremely high energy prices, will further increase their discomforts during the coming winter.
NOTE: Norway, trying to be a good EU neighbor, produced too much electricity for export to Germany, etc., in 2022. This has resulted in low-reservoir levels, further worsened by less-than-normal meltwater and a West European drought. As a result, household electric rates have been "administratively" increased to extremely high levels to discourage consumption and save reservoir water.
NOTE: The unlabelled vertical axis of the below image is grid load, MW, on the NE grid
Turnkey Capital Costs of Grid-Scale Battery Systems
The battery system would need to provide a certain level of power, MW, and energy, MWh, during a one-day wind/solar lull.
At present, the existing power plants, connected to the NE high-voltage grid, augmented with imports, supply the required MW and MWh, during the peak hours of late-afternoon/early-evening
During a wind/solar lull, and a required peak load of 27,500 MW:
- Almost all solar would be near zero during late-afternoon/early-evening, and
- Wind would be at 15% of annual average, or less, during late-afternoon/early-evening.
A significant MW of wind/solar would not be there, unless the traditional sources are present.
That means almost none of the traditional sources, and their fuel supplies, can be shutdown.
NOTE: I have lived in my house, at 1000-ft elevation, in Vermont, for 32 years. My observation is there is almost no wind from 4 to 5 AM to 9 to 10 AM, almost every day.
The US turnkey capital costs of complete battery systems in 2020, including land, foundations, fencing, lighting, step-up and step-down transformers was about $550/kWh, as AC at battery voltage, per EIA survey reports. See note and URL at bottom of article
Battery systems age at about 1.5%/y; the capacity loss would be about 25% in year 15
Tesla recommends operating the battery system from 20% full to 80% full, for maximum useful service life, about 15 years.
The battery system almost always operates well within that range.
Turnkey capital cost = 0.147500 TWh, shortfall x $550/kWh x 1.25, aging factor = $101 billion; 2020 pricing.
NOTE: If the battery system had to supply a high level of power, MW, as well as the above energy, MWh, the cost would be significantly greater.
NOTE: After looking at several aerial photos of large-scale battery systems with many Tesla Megapacks, it is clear many other items of equipment are shown, other than the Tesla supply, such as step-down/step-up transformers, connections to the grid, land, foundations, access roads, fencing, security, site lighting, i.e., the cost of the Tesla supply is only one part of the total battery system cost on a site.
Some Comments
The above $101 billion of battery systems is for a one-day wind/solar shortfall
The $101 billion is based on daily averages derived from annual TWh quantities and assumes there are no other sources, except battery systems, to make up the shortfall.
As listed above, it is likely there would be other sources, including some oil/gas CCGT power plants, as standby, to perform services, including peaking, as needed.
Most lulls last 1 to 3 days, but some lulls last 5 to 7 days, and may be followed by a second multi-day lull a few days later (as happened in Germany and NE), when the NE battery systems may not yet be adequately full, because they could have been at about 20% full after counteracting the first lull.
ISO-NE Daily Dashboard
The dashboard shows the:
System Load Graph
It shows the real-time load, MW. Hovering shows the data.
If you click on the rectangle, you get the spreadsheet showing the contribution, MW, by source, on a minute-by-minute basis
If you click on the date, type in a different date, you get the spreadsheet for that date.
Spreadsheets can be obtained for any date of 2022, or any prior year. See URL
https://www.iso-ne.com/isoexpress/web/charts
Circular Fuel Mix Chart
It shows a snapshot, of one particular time, of the real-time contribution to grid load, %, by source.
Here is an example
The ISO-NE Dashboard showed the following sources and their loads on the NE high-voltage grid on August 05, 2022, at 6:37 pm, in the middle of of the peak hour period.
Wind and solar contribution to peak load conditions is minimal, as usual.
Source
MW
%
Natural Gas
14505
71.48
Nuclear
3336
16.43
NE Hydro; pre-existing
1722
8.48
Solar on high-voltage grid
57
0.28
Wind on high-voltage grid
112
0.55
Wood burning; 25% eff; pre-existing
196
0.96
Municipal refuse burning; pre-existing
303
1.49
Methane gas from landfills
35
0.17
Other
38
0.18
Total
20304
100.02
Improved Fuel Mix Chart Not Published for Political Reasons
ISO-NE also provides the MW contribution of each source on a five minute basis. Here is the image for August 4, 2022. This grid load graph reflects the impact of distributed solar systems connected to distribution grids, as discussed below.
The below graph, prepared by Warren Van Wyck, shows the NE grid is greatly dependent on natural gas, nuclear and imports from nearby grids, and on NE hydro during peak hours.
Any attempt to curtail them, and their energy supplies, would be an-off-the-charts folly
The graph, with MW on the vertical axis and time on the horizontal axis, clearly reveals what happened during a 24-h period.
- The blank band at the top was imports from nearby grids.
- Oil, dark gray, was used during peak demand hours to reduce gas consumption.
- HV grid-connected solar, yellow, was just a sliver of the total load during peak hours.
- Wind, dark brown, was just a sliver of the total load during peak hours
- NE hydro, blue, was maximal during peak hours, because owners are paid the highest c/kWh.
- Nuclear maintained a steady output
- Natural gas, light blue, provided the most contribution to the grid load, BY FAR.
THIS GRAPH DOES NOT SHOW THE SOLAR OUTPUT OF 3858 MW, AT ABOUT NOONTIME, ON DISTRIBUTION GRIDS
Here's the link to interactive graph of fuel mix for August 4, 2022, which shows the ISO-NE-estimated solar output on distribution grids from rooftops, meadows, etc.; thin line at the bottom.
That power is not fed into the NE high-voltage grid, i.e., it stays on distribution grids.
Graph by Warren Van Wyck
This is a new power source that has grown over the past 15 years.
It is complementary to the power sources connected to the NE high-voltage grid.
Together they serve the electrical requirements (MW and MWh) of the New England economy.
If that complementary output had not been there, the power sources connected to the NE high-voltage grid would have to increase there outputs.
Solar is a Hit or Miss Electricity Source
Here is a graph of the NE high-voltage grid load curve on October 22, 2010, before any significant contribution from solar systems on distribution grids, which is equivalent to an overcast day. See Note.
The morning load ramp is steep from 4 am to 8 am, the load stays flat for most of the day, then increases to a peak at 6:30 pm.
NOTE: A grid load graph for October 22, 2022, 12 years later, with about 5500 MW of installed solar systems, would be similar to the October 22, 2010, graph, with minimal solar systems installed, on an overcast day.
The above August 4, 2022, graph would have looked about the same, but now distributed solar did make a significant contribution, because it was a sunny day. Its morning load ramp was more gradual, until reaching peak load at about 6:30 pm
A series of graphs during a multi-day wind/solar lull would clearly show the minimal contribution of wind and solar, especial during the peak grid load hours of late-afternoon/early-evening.
Those graphs would be far more useful, and revealing, than the present Circular Fuel Mix Chart, which shows just snapshot, for one particular time.The Improved Fuel Mix Graph, would use the same data, but would show what happened during 24 hours
ISO-NE likely has Improved Fuel Mix Charts in its archives, including for the most stressful days, but they are not made public, because they would clearly show wind and solar could not be relied upon, which, if revealed, would rain on the highly subsidized wind/solar parade.
It is well-known, wind and solar provide electricity at random, not when it is needed to help out during stressful days, especially during peak grid load periods.
An additional big question remains. What part of the peak electricity loaded onto the grid, MW and MWh, would need to be provided by grid-scale battery systems on stressful days, and on all other days?
Distributed Solar Systems Connected to Distribution Grids
The output of these solar systems is seen by ISO-NE as a reduction in grid load. ISO-NE estimates the reduction, based on solar conditions throughout New England, for planning purposes, each day.
Here is an example:May 1, 2022, was a rare sunny day all over New England. There was an installed capacity of about 5000 MW of distributed solar systems on rooftops and meadows, etc., of which about 2700 MW in Massachusetts, 900 MW in Connecticut, and 475 MW in Vermont. That capacity generated a maximum of about 4000 MW around noontime. See URL
https://www.euci.com/new-england-hits-a-record-low-in-electricity-d...
The Fuel Mix Graph for May 1, 2022, showed a NE high-voltage grid load of about 7580 MW, around noontime.
It would have been about 7580 + 4000 = 11500 MW, at around noontime, if distributed solar had not existed.
With plenty of solar, the generating plants connected to the NE high voltage grid more gradually increased their outputs, until about noontime, after which they further increased their outputs, while the output of distributed solar was decreasing to near zero, by late-afternoon/early-evening.
The shape of the May 1, 2022, grid load graph would be similar to the above colored grid load graph.
The daily down/up ramping is performed mostly by the flexible, quick-reacting, gas/oil-fired CCGT plants. Those plants also ramp up and down to counteract the random output variations of wind 24/7/365. See blue area of colored grid load graph.
Those CCGT plants, often vilified, because they are "fossil", in fact, are the unsung heroes that make it possible for wind and solar to even exist on the grid.
Up/down ramping, at part-load, of CCGT power plants is inefficient and more expensive.
They have more c/kWh, more Btu/kWh, more CO2/kWh, more wear-and-tear/kWh, just as a car in urban traffic.
That expense is not charged to solar system owners, but "absorbed" by CCGT plant owners and ratepayers.
The CCGT plants would have to provide much greater loads to the NE high-voltage grid on rainy, overcast days, and on days with snow/ice on the panels, because solar on distribution grids would be minimal.
NOTE: ISO-NE estimated, on 12:30 pm of August 4, 2022:
Distributed solar at 3858 MW
NE high-voltage grid solar at 452 MW
NOTE: None of the solar on distribution grids (including Vermont’s 475 MW x 0.8 = 380 MW, around midday, on a very sunny day) is transmitted to the NE high-voltage grid. All of it is consumed by users on the distribution grids for their heat pumps, air conditioners, electric vehicles, etc.
Future Grid-Scale Battery System Turnkey Costs
Proponents of grid-scale battery systems, such as financial advisors Bloomberg, Lazard, etc., have been claiming the cost of battery systems would be decreasing to $100/kWh, delivered as AC, at battery voltage, in the near future; the so-called Holy Grail.
Such a claim is similar to the mantra "Nuclear power will be too cheap to meter".
Those claims nave been, and still are, off-the-charts ridiculous for at least the next 10 years.
Example:
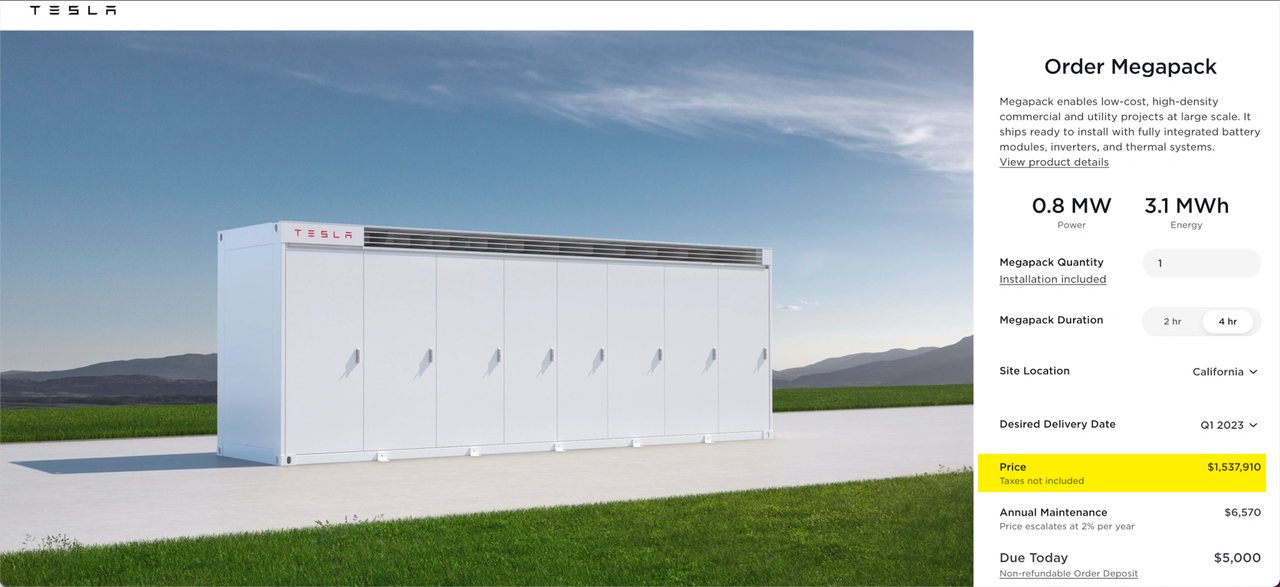
Recently, Tesla, one of the largest suppliers of battery systems in the world, increased its 2021 pricing for a standard module Megapack by 24.5% for 2022. See URL
The Megapack pricing, and for complete grid-scale battery systems, for 2025, likely will be much higher, due to:
1) Increased inflation rates,
2) Increased interest rates,
3) Supply chain disruptions,
4) Increased energy prices, such as of oil, gas, coal, etc., and
5) Increased materials prices, such as of Tungsten, Cobalt, Lithium, Copper, etc. See URLs
https://cms.zerohedge.com/s3/files/inline-images/2022-03-21_15-28-4...
https://www.zerohedge.com/commodities/tesla-hikes-megapack-prices-c...
Maine as Third World Country:
CMP Transmission Rate Skyrockets 19.6% Due to Wind Power
Click here to read how the Maine ratepayer has been sold down the river by the Angus King cabal.
Maine Center For Public Interest Reporting – Three Part Series: A CRITICAL LOOK AT MAINE’S WIND ACT
******** IF LINKS BELOW DON'T WORK, GOOGLE THEM*********
(excerpts) From Part 1 – On Maine’s Wind Law “Once the committee passed the wind energy bill on to the full House and Senate, lawmakers there didn’t even debate it. They passed it unanimously and with no discussion. House Majority Leader Hannah Pingree, a Democrat from North Haven, says legislators probably didn’t know how many turbines would be constructed in Maine if the law’s goals were met." . – Maine Center for Public Interest Reporting, August 2010 https://www.pinetreewatchdog.org/wind-power-bandwagon-hits-bumps-in-the-road-3/From Part 2 – On Wind and Oil Yet using wind energy doesn’t lower dependence on imported foreign oil. That’s because the majority of imported oil in Maine is used for heating and transportation. And switching our dependence from foreign oil to Maine-produced electricity isn’t likely to happen very soon, says Bartlett. “Right now, people can’t switch to electric cars and heating – if they did, we’d be in trouble.” So was one of the fundamental premises of the task force false, or at least misleading?" https://www.pinetreewatchdog.org/wind-swept-task-force-set-the-rules/From Part 3 – On Wind-Required New Transmission Lines Finally, the building of enormous, high-voltage transmission lines that the regional electricity system operator says are required to move substantial amounts of wind power to markets south of Maine was never even discussed by the task force – an omission that Mills said will come to haunt the state.“If you try to put 2,500 or 3,000 megawatts in northern or eastern Maine – oh, my god, try to build the transmission!” said Mills. “It’s not just the towers, it’s the lines – that’s when I begin to think that the goal is a little farfetched.” https://www.pinetreewatchdog.org/flaws-in-bill-like-skating-with-dull-skates/
Not yet a member?
Sign up today and lend your voice and presence to the steadily rising tide that will soon sweep the scourge of useless and wretched turbines from our beloved Maine countryside. For many of us, our little pieces of paradise have been hard won. Did the carpetbaggers think they could simply steal them from us?
We have the facts on our side. We have the truth on our side. All we need now is YOU.
“First they ignore you, then they laugh at you, then they fight you, then you win.”
-- Mahatma Gandhi
"It's not whether you get knocked down: it's whether you get up."
Vince Lombardi
Task Force membership is free. Please sign up today!
Hannah Pingree on the Maine expedited wind law
Hannah Pingree - Director of Maine's Office of Innovation and the Future
"Once the committee passed the wind energy bill on to the full House and Senate, lawmakers there didn’t even debate it. They passed it unanimously and with no discussion. House Majority Leader Hannah Pingree, a Democrat from North Haven, says legislators probably didn’t know how many turbines would be constructed in Maine."
https://pinetreewatch.org/wind-power-bandwagon-hits-bumps-in-the-road-3/
© 2024 Created by Webmaster.
Powered by
![]()
You need to be a member of Citizens' Task Force on Wind Power - Maine to add comments!
Join Citizens' Task Force on Wind Power - Maine